Infytrix
Brief
Infytrix is a perfect choice to excel in your business as we hold the expertise in marketing, technology, financing, artificial intelligence and content optimization to aid your brand with immense growth and success. Infytrix assure to support the client with vast knowledge of different domains.
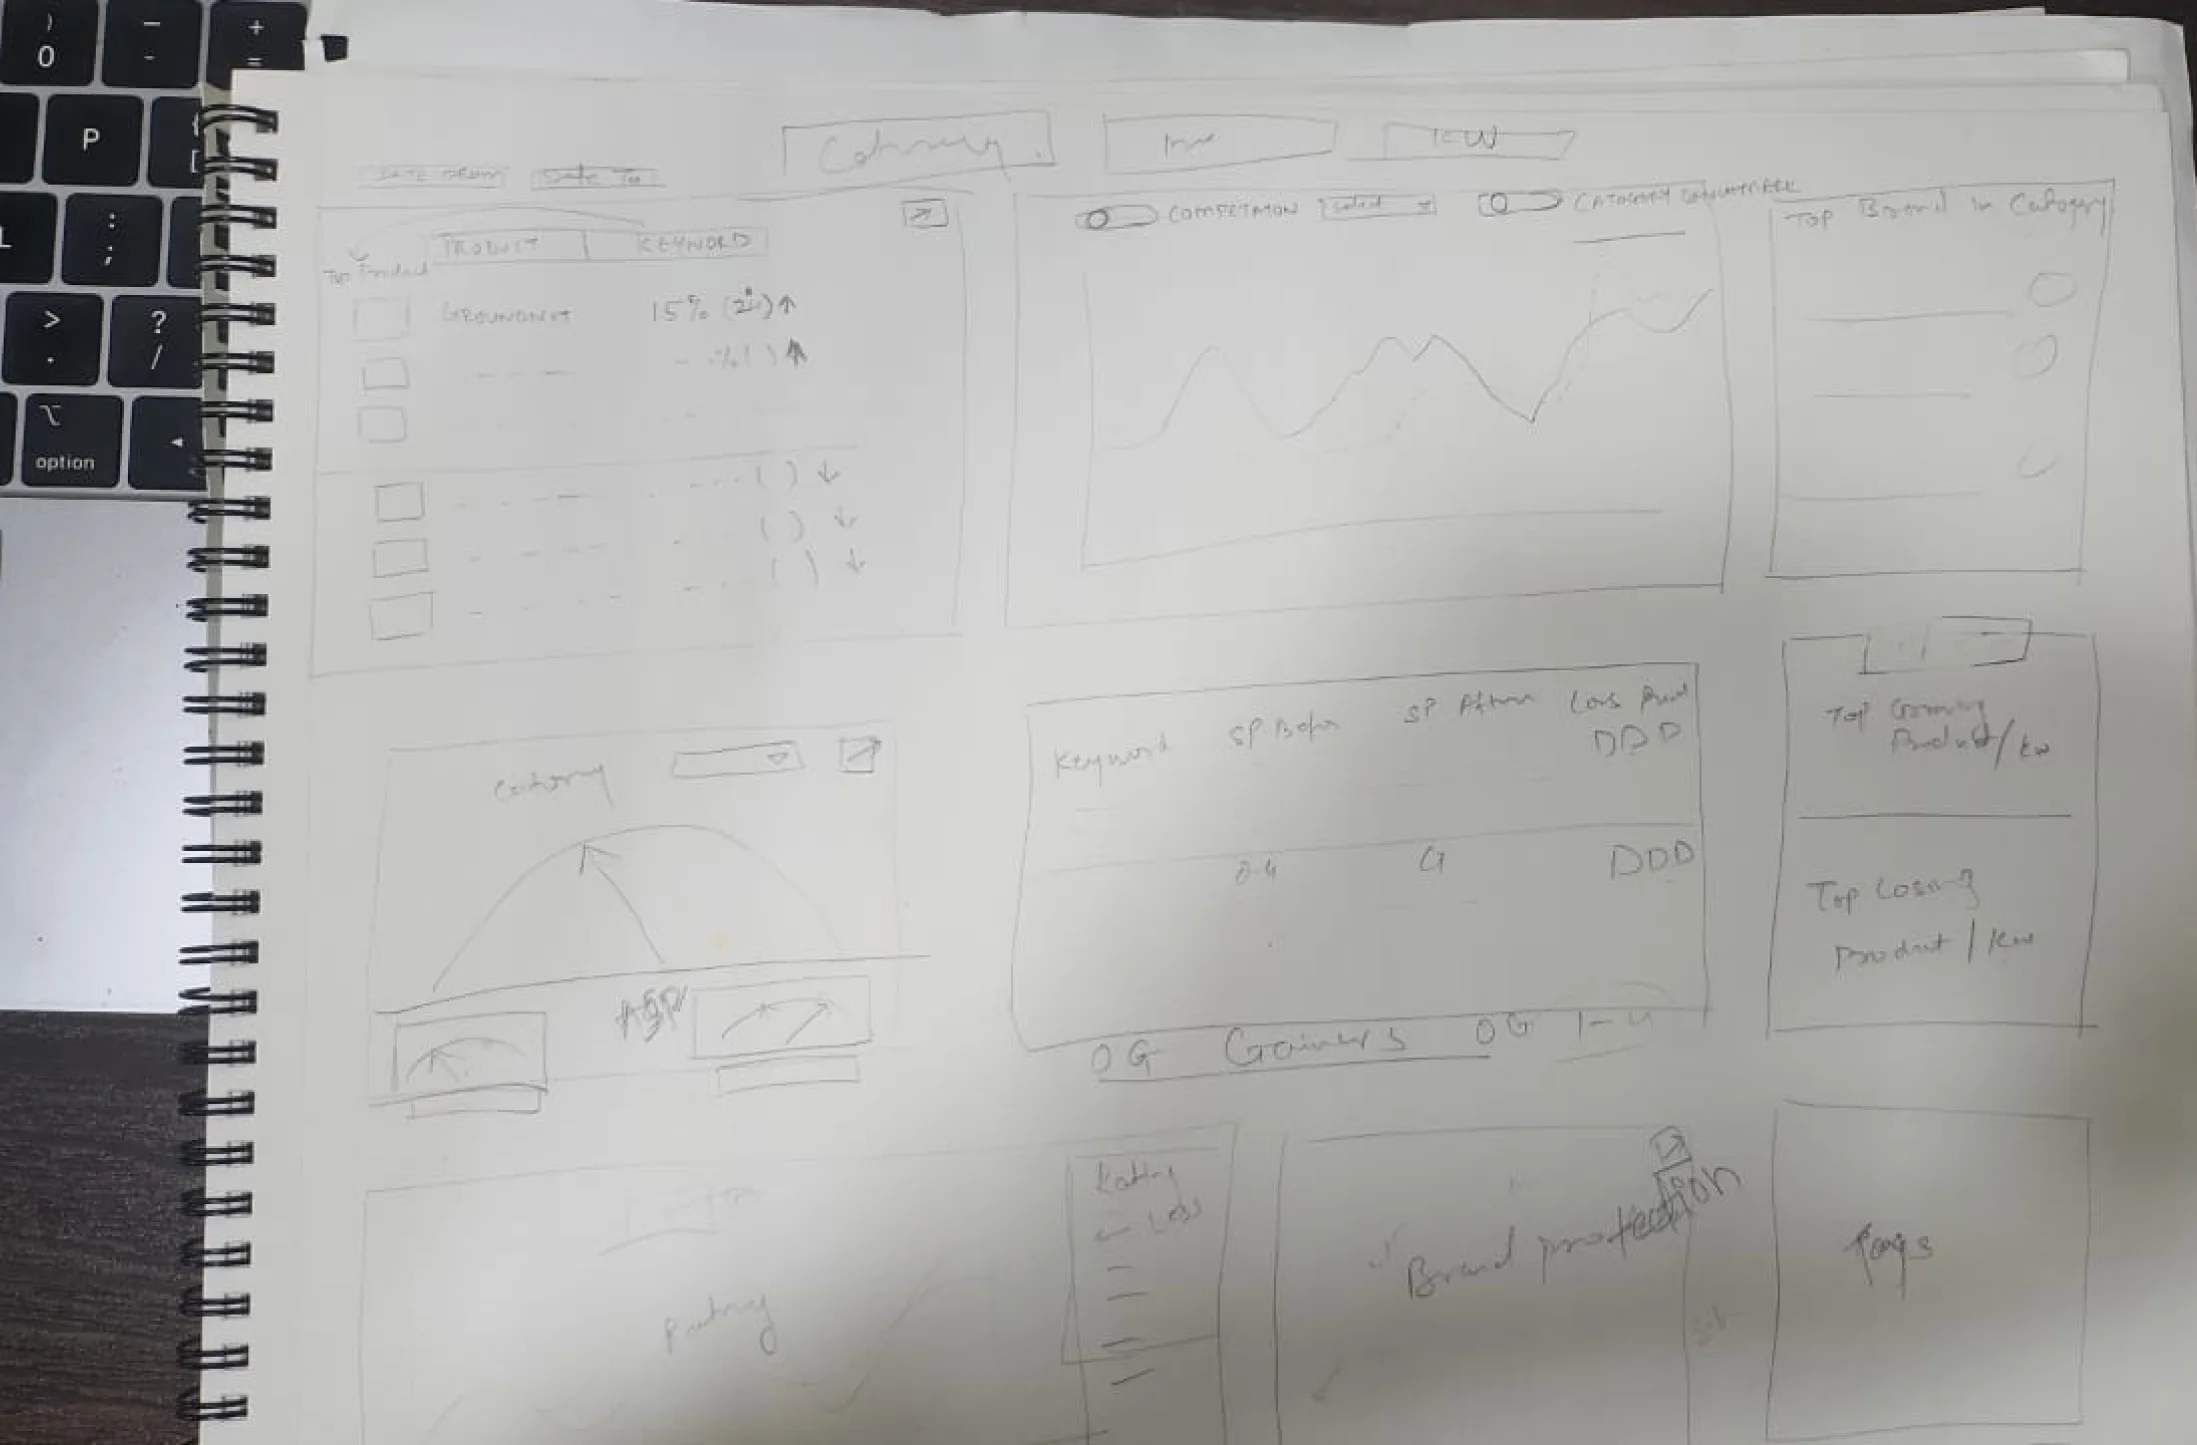
Sketch: Dashboard
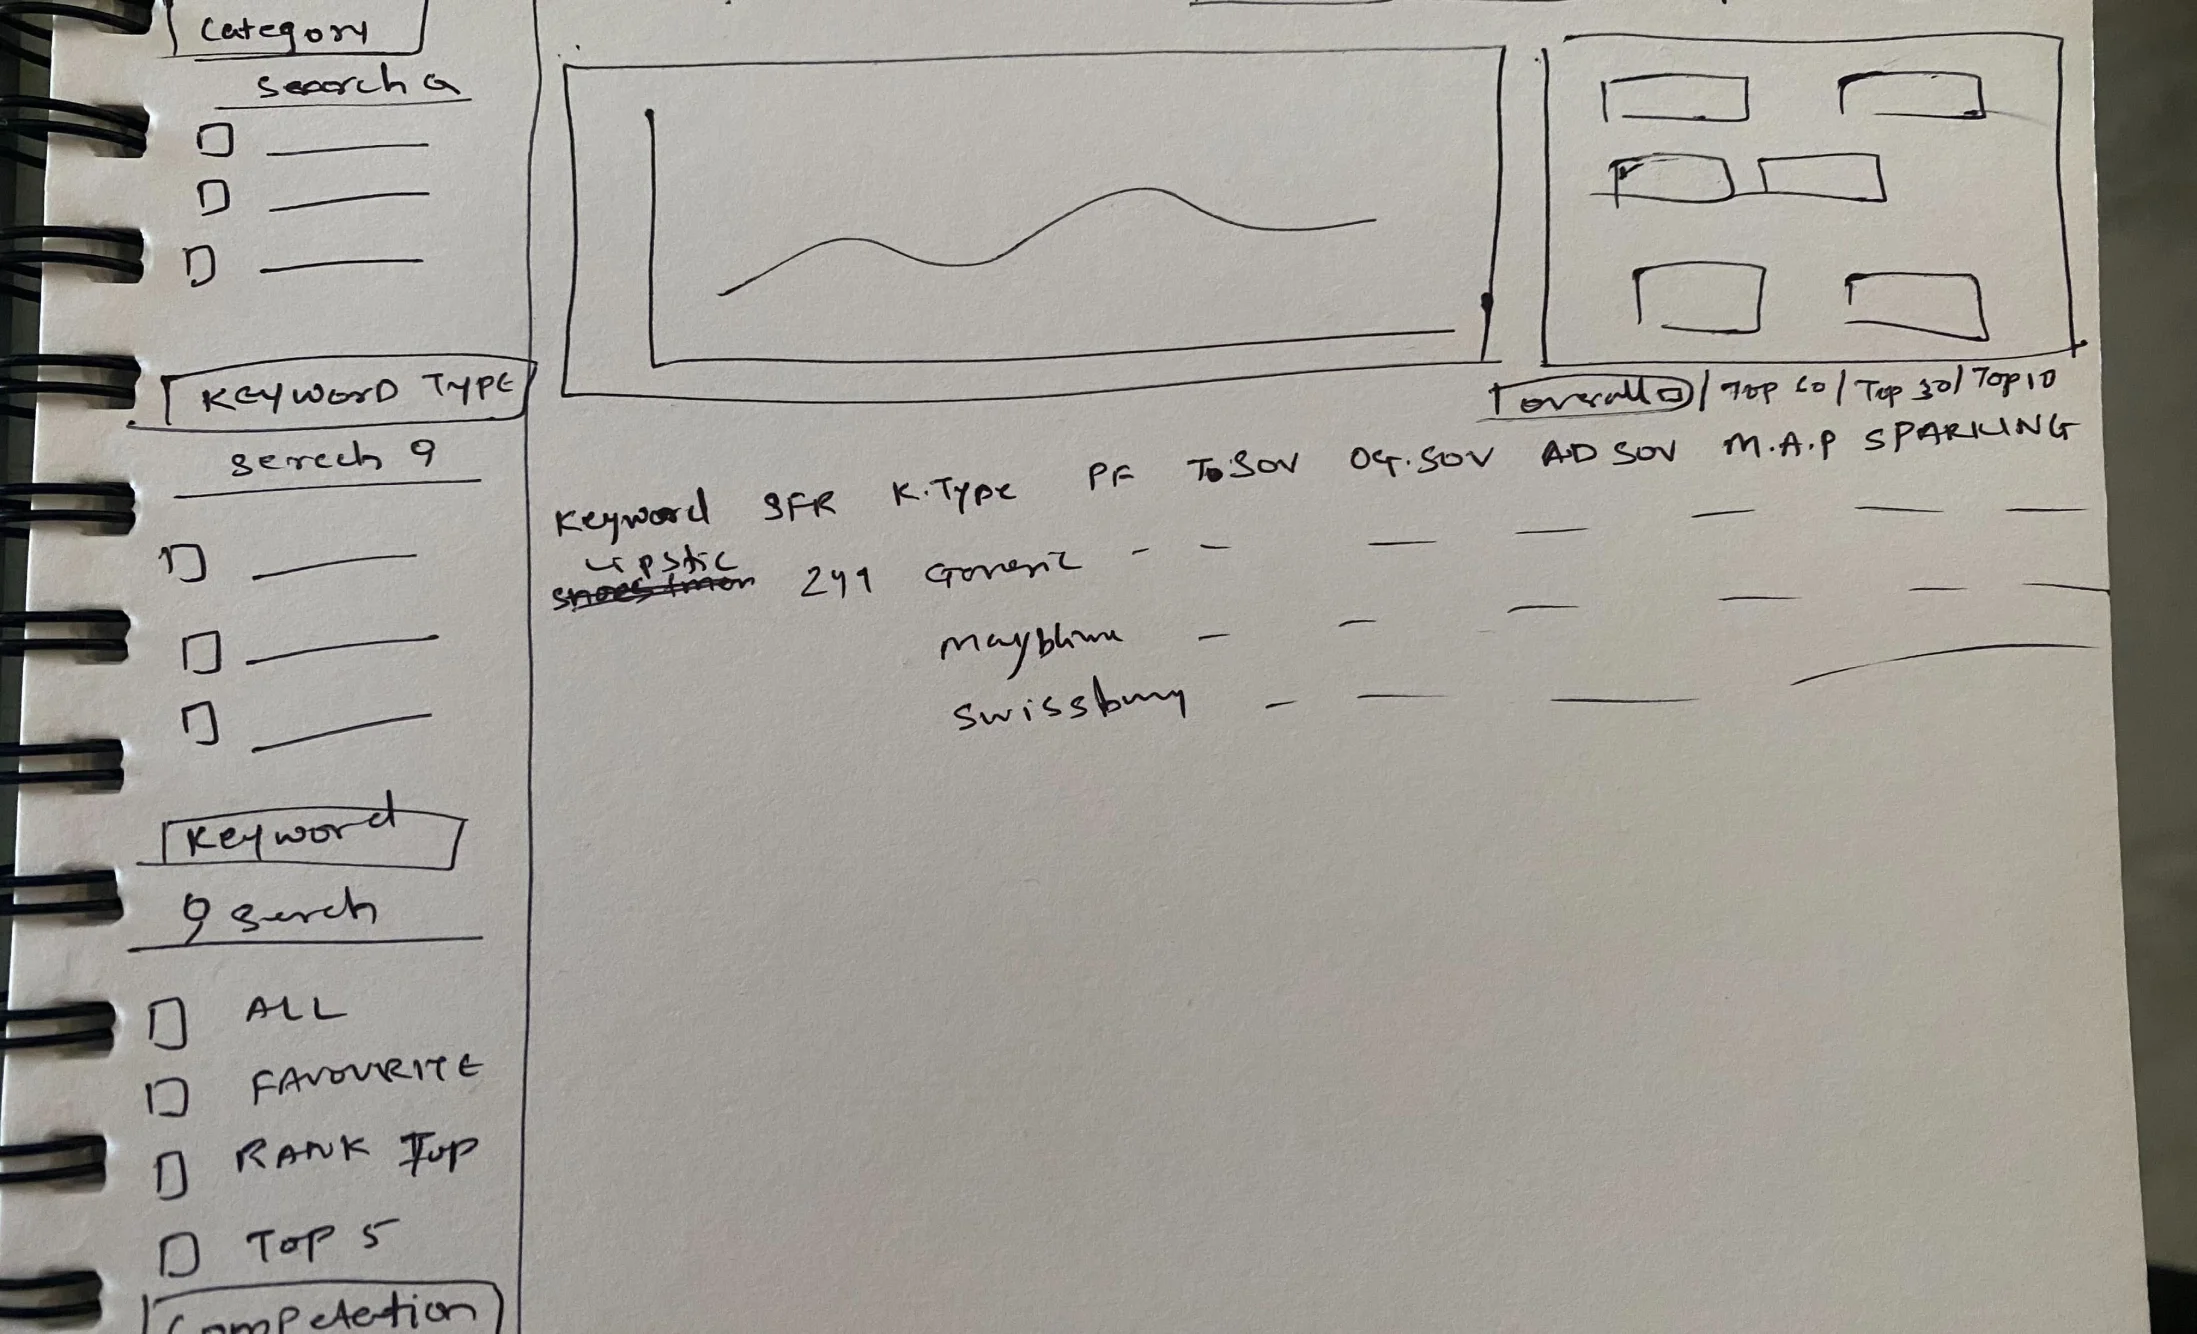
Sketch: Dashboard Internal Page
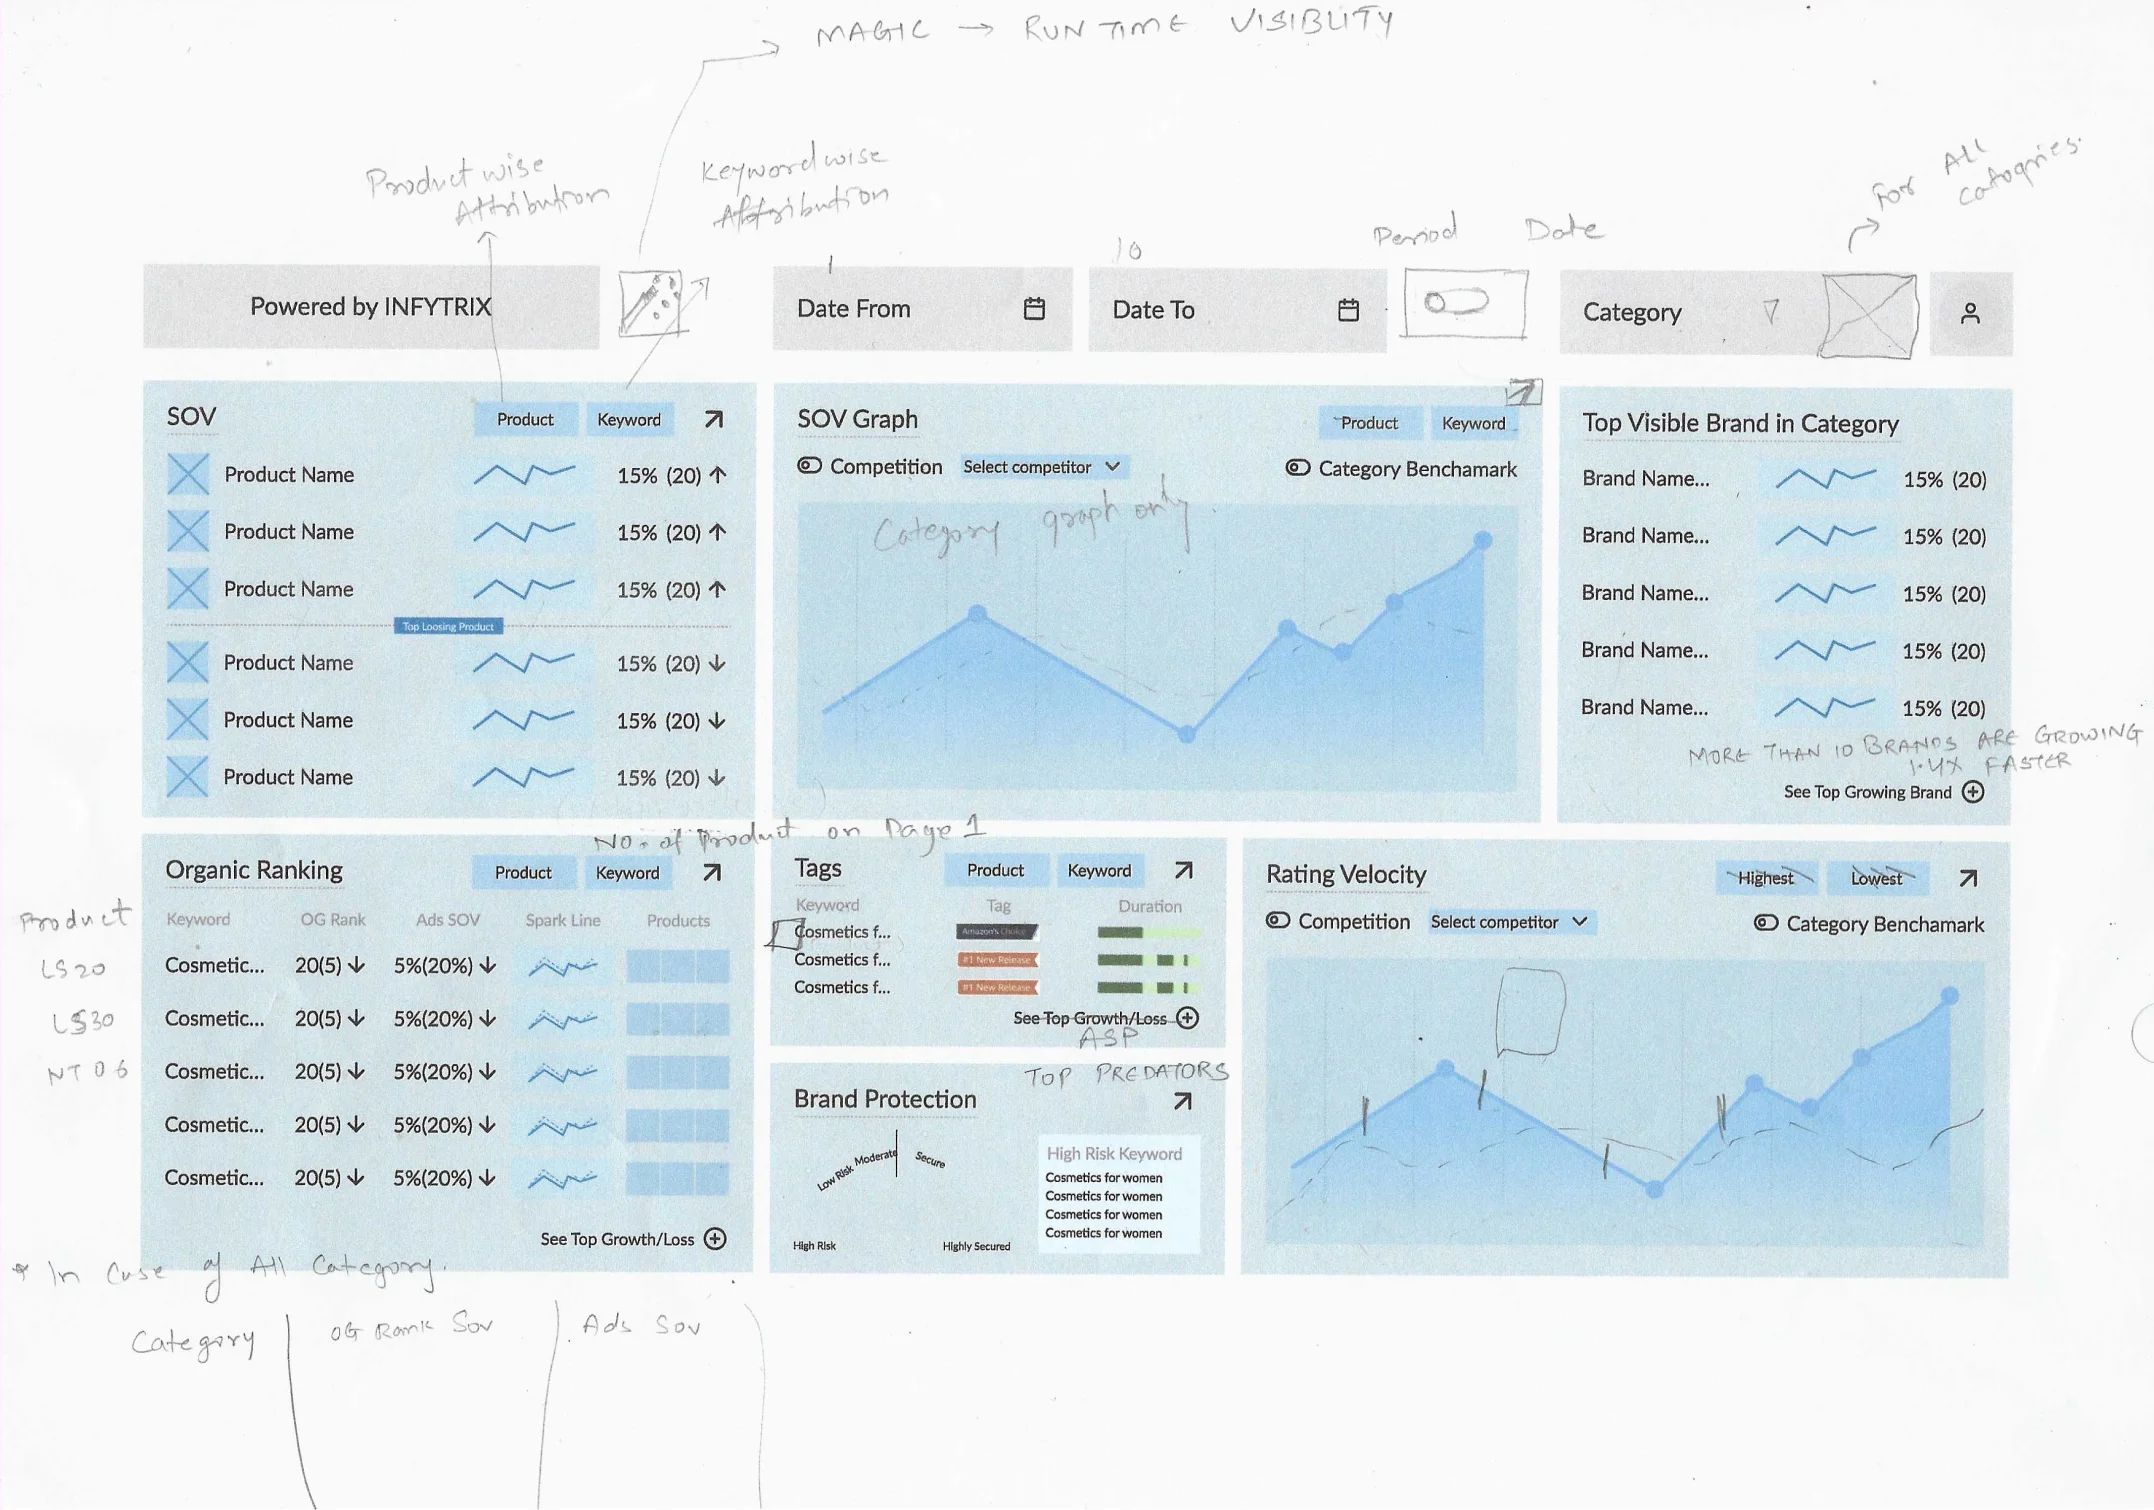
Wireframing: Dashboard
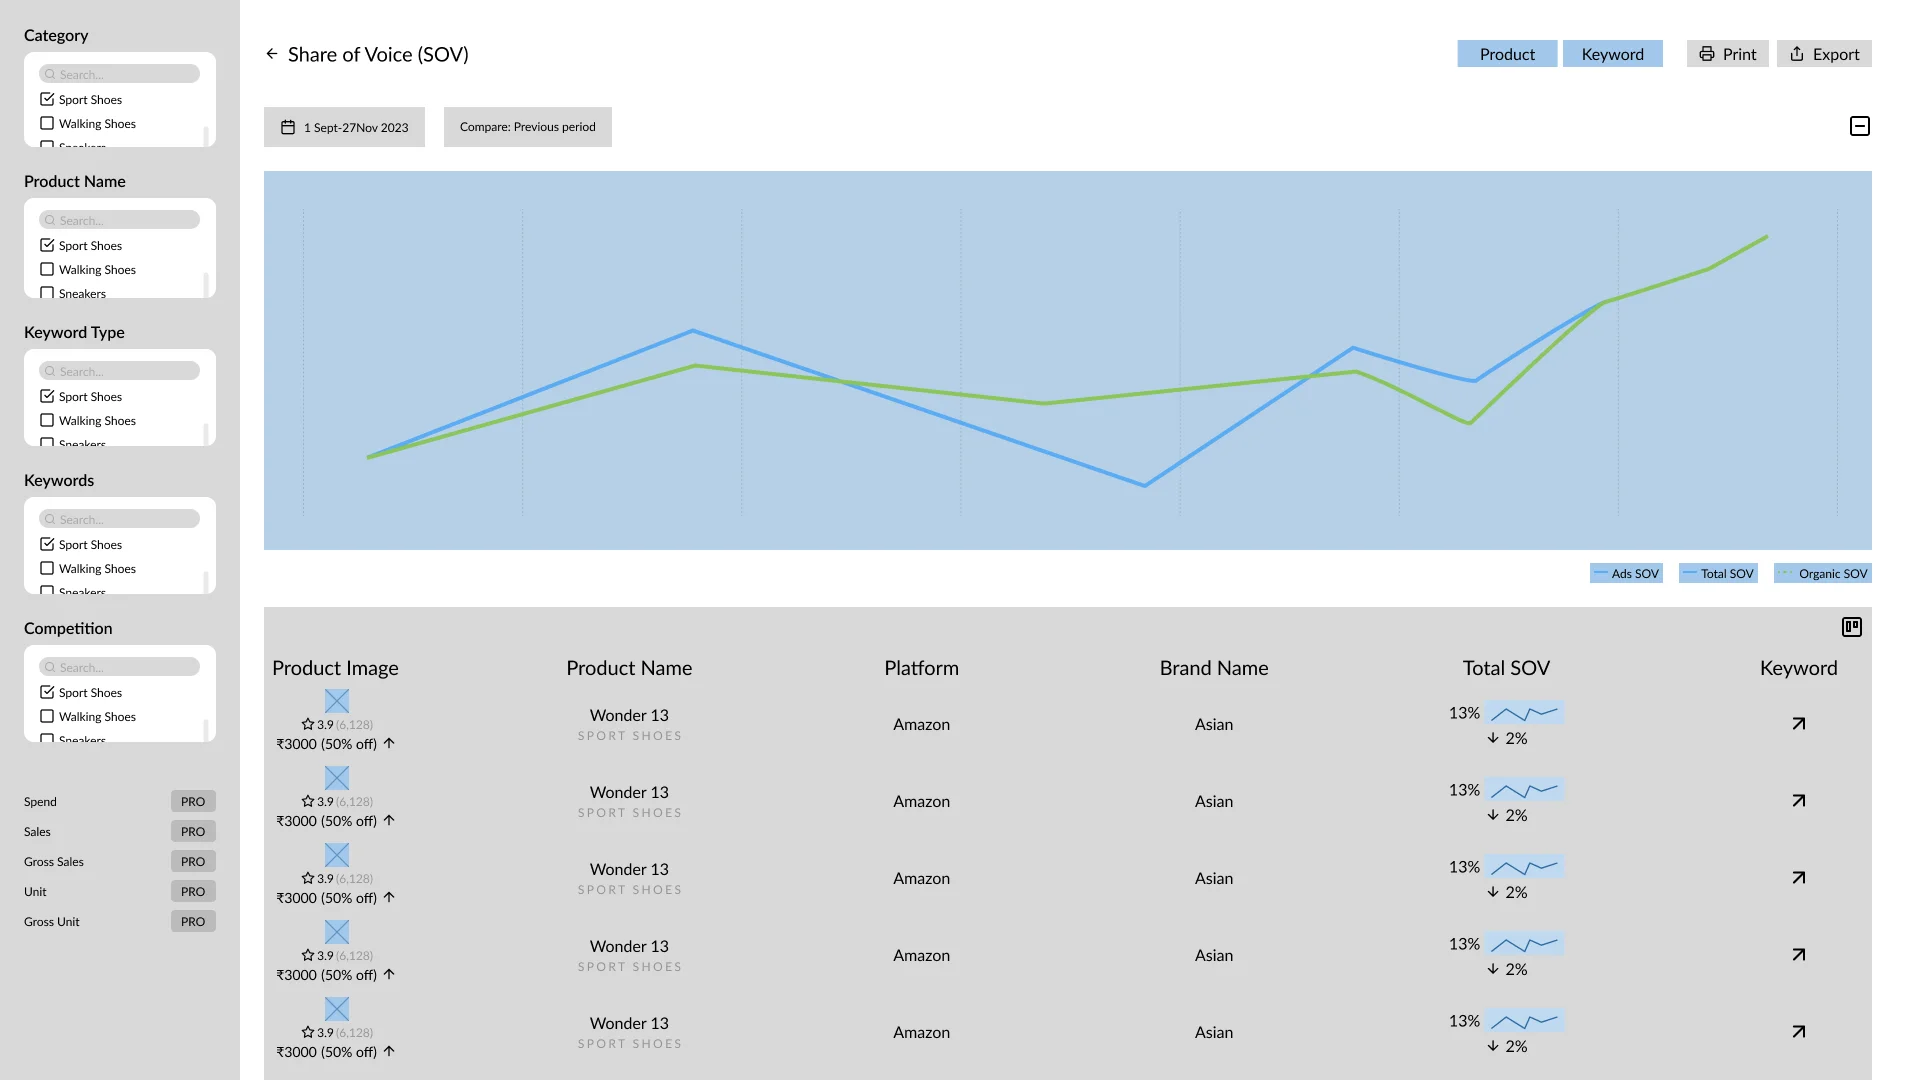
Wireframing: Dashboard Internal Page
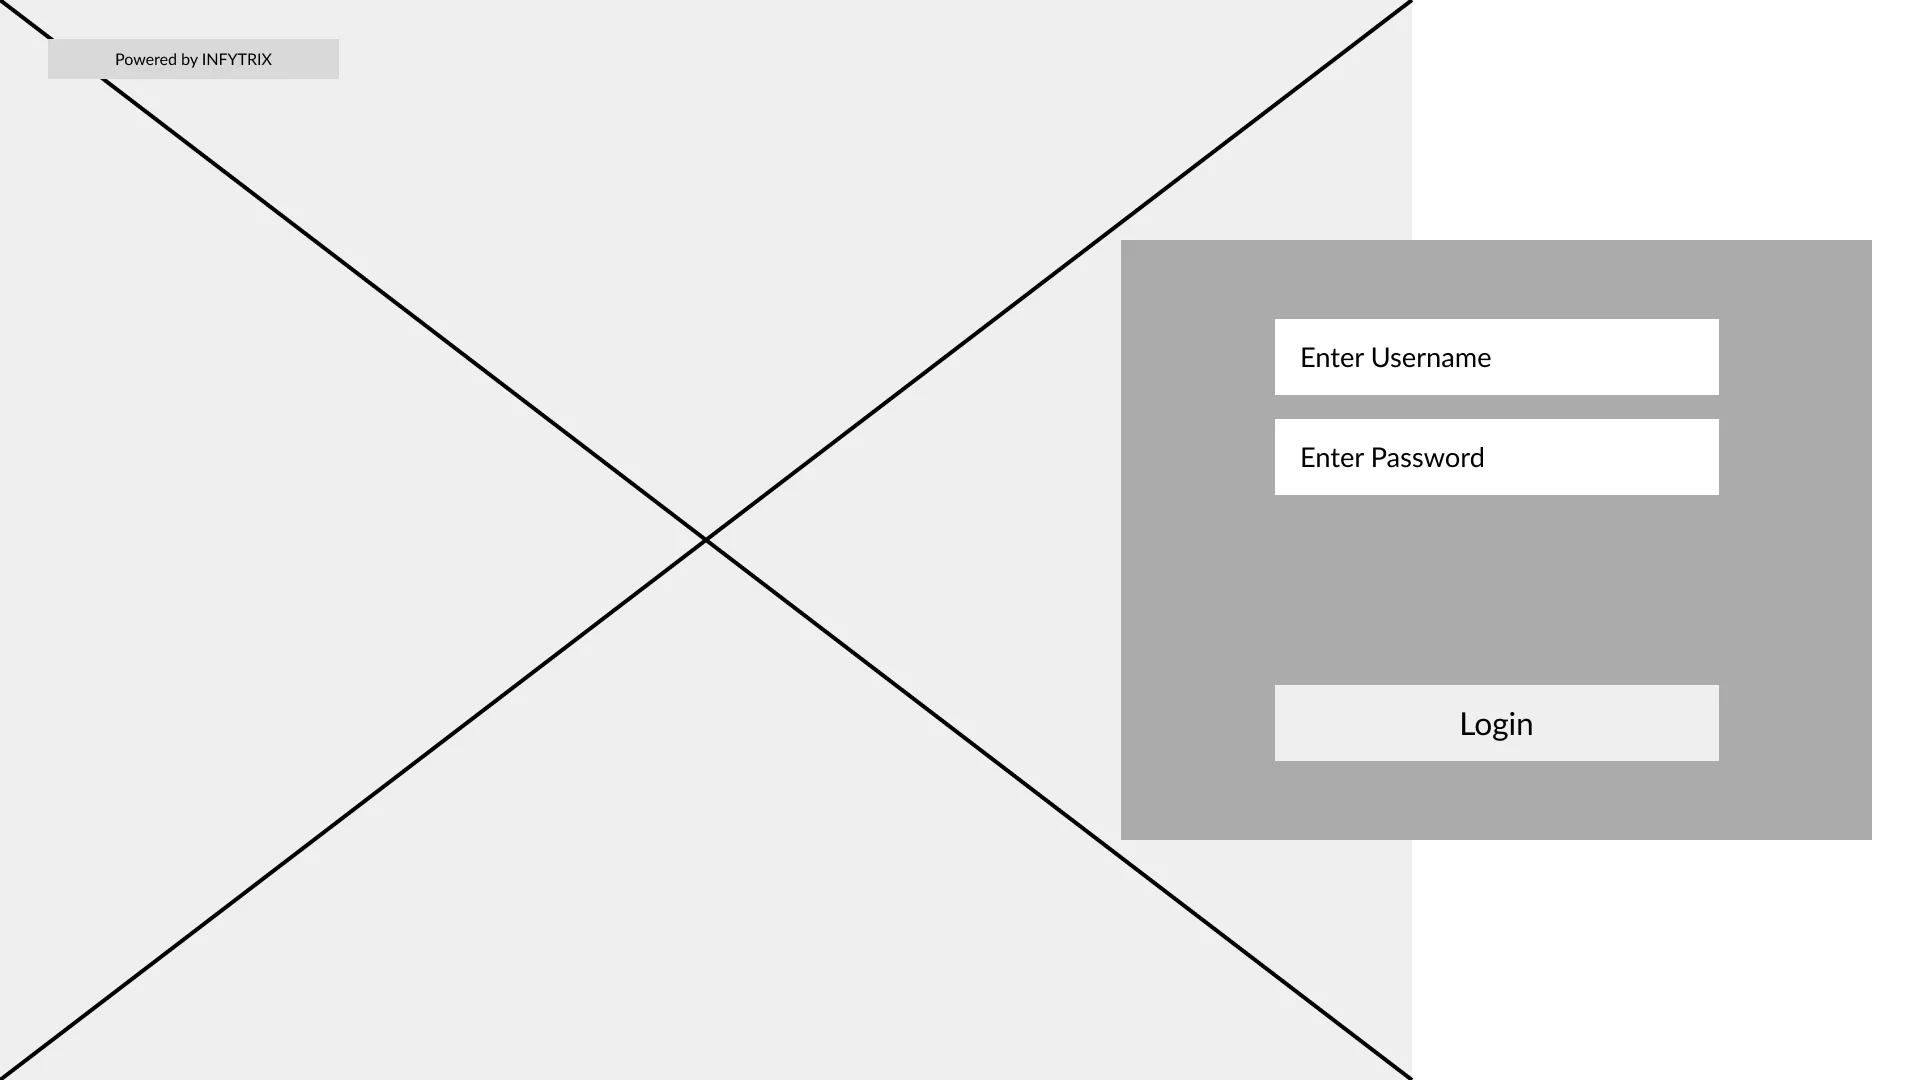
Wireframing: Login Page
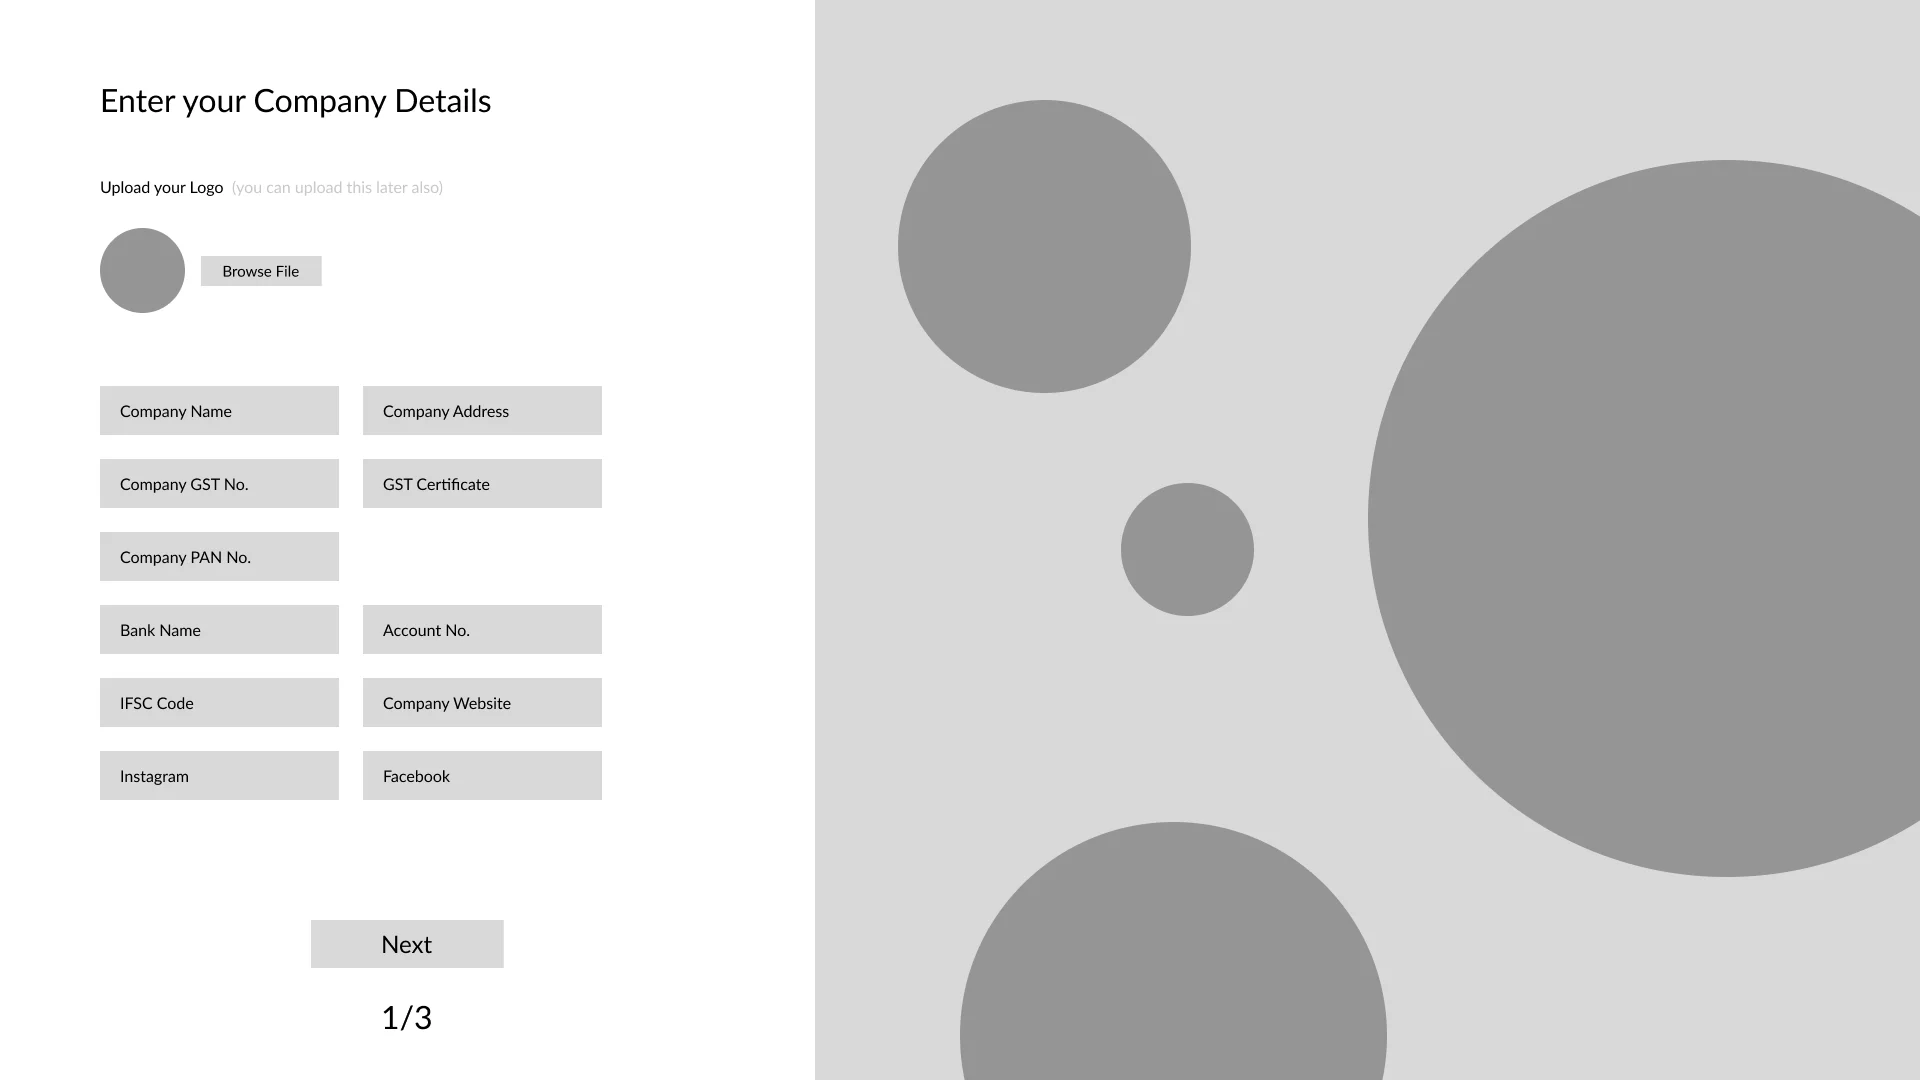
Wireframing: Company Details
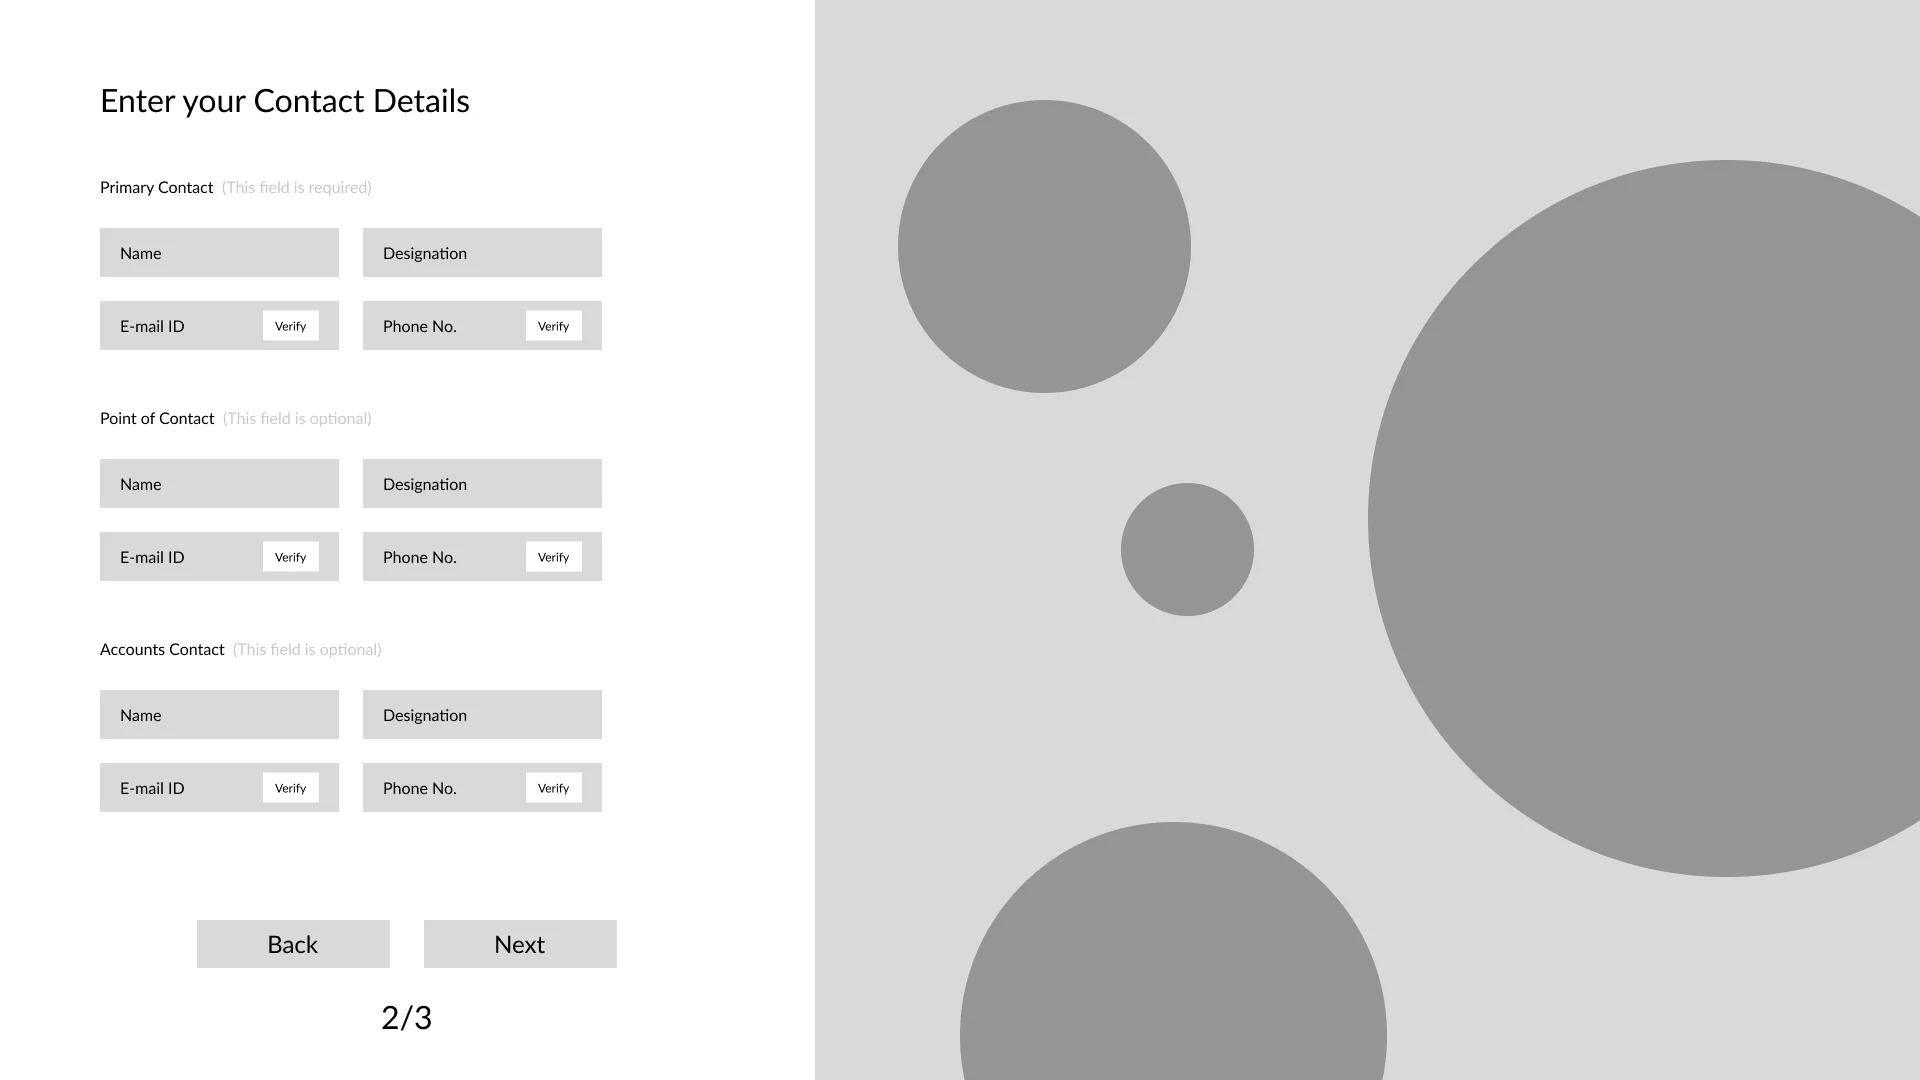
Wireframing: Contact Details
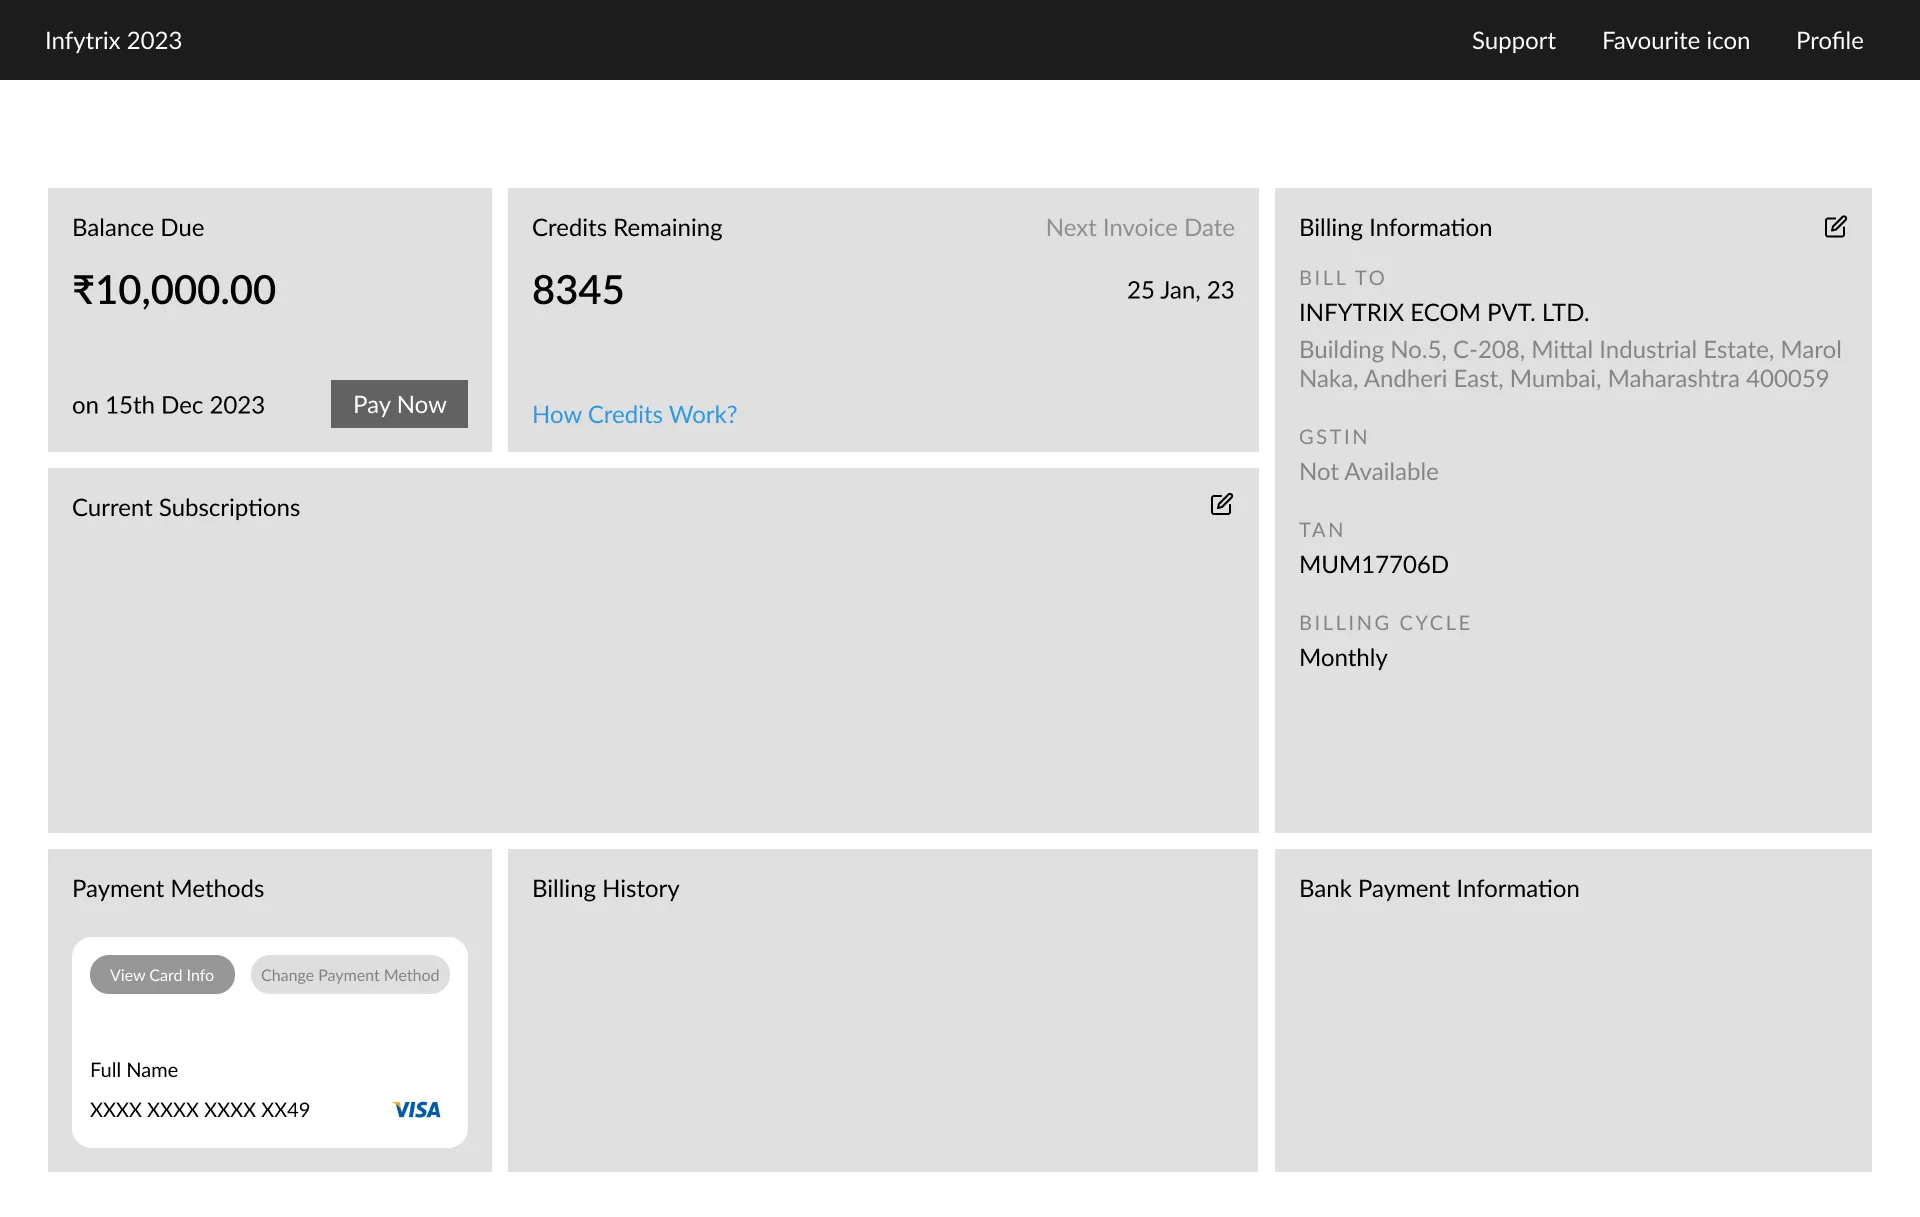
Wireframing: Account Details
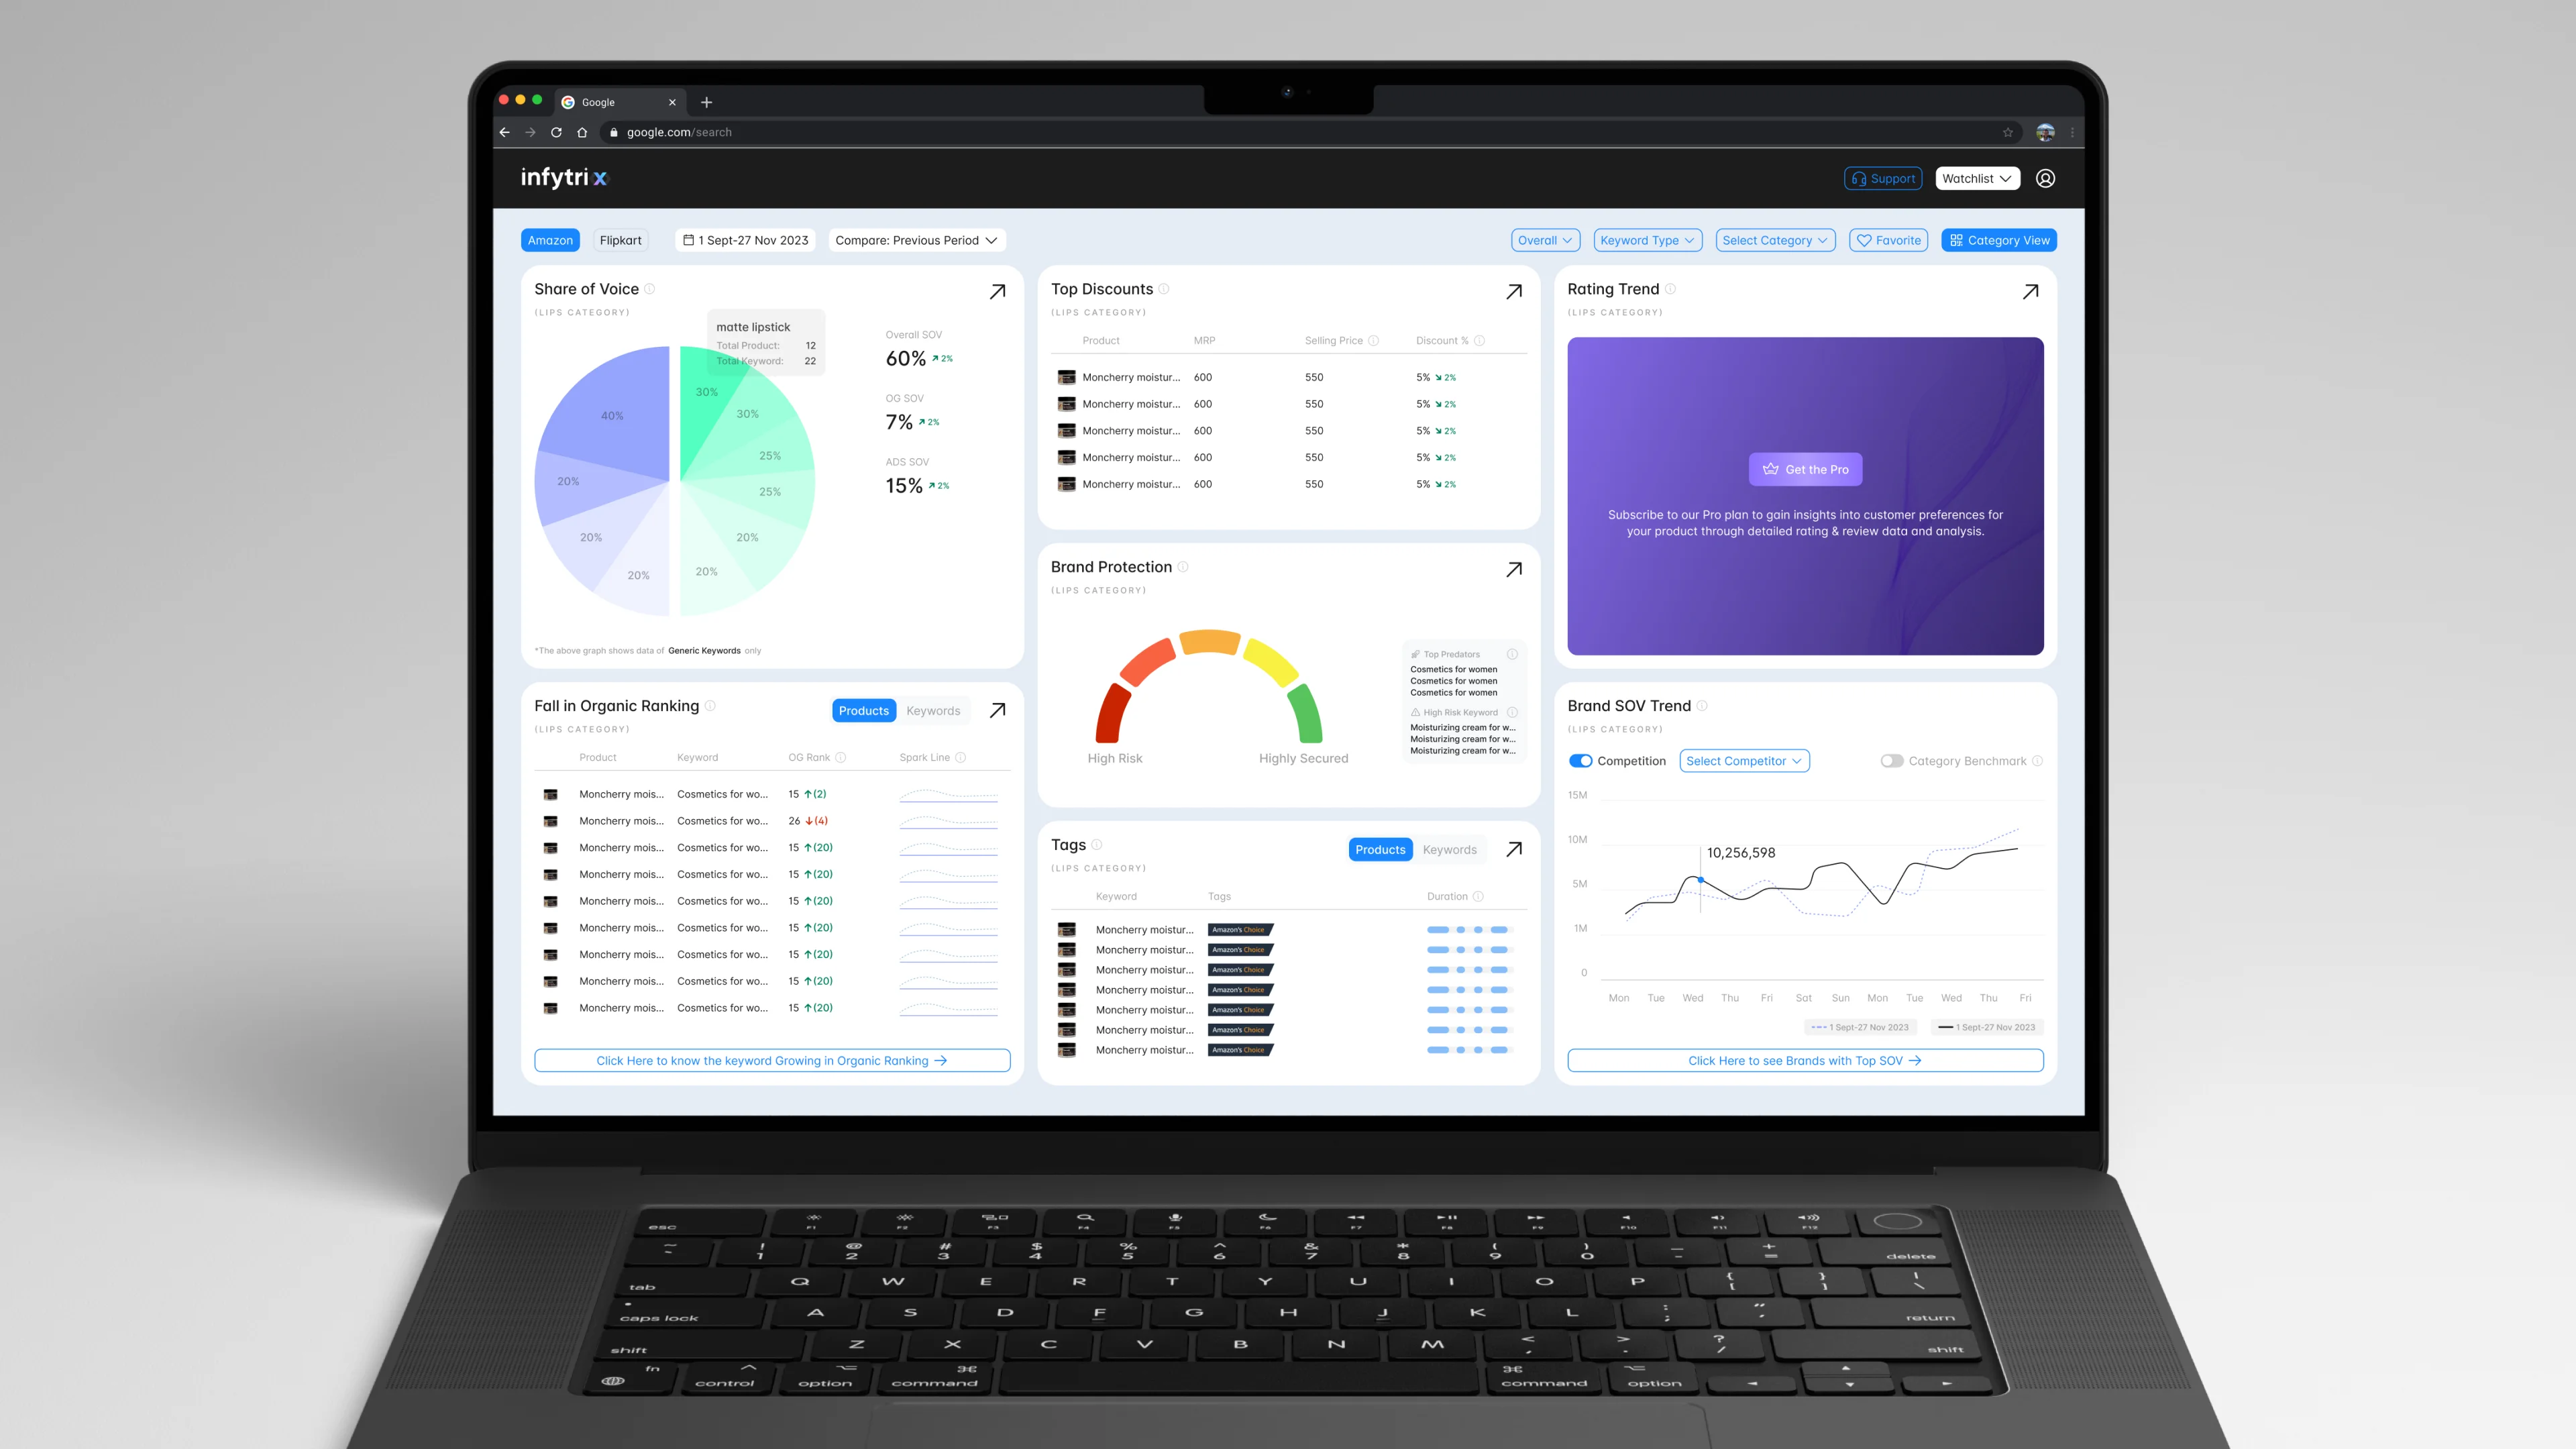
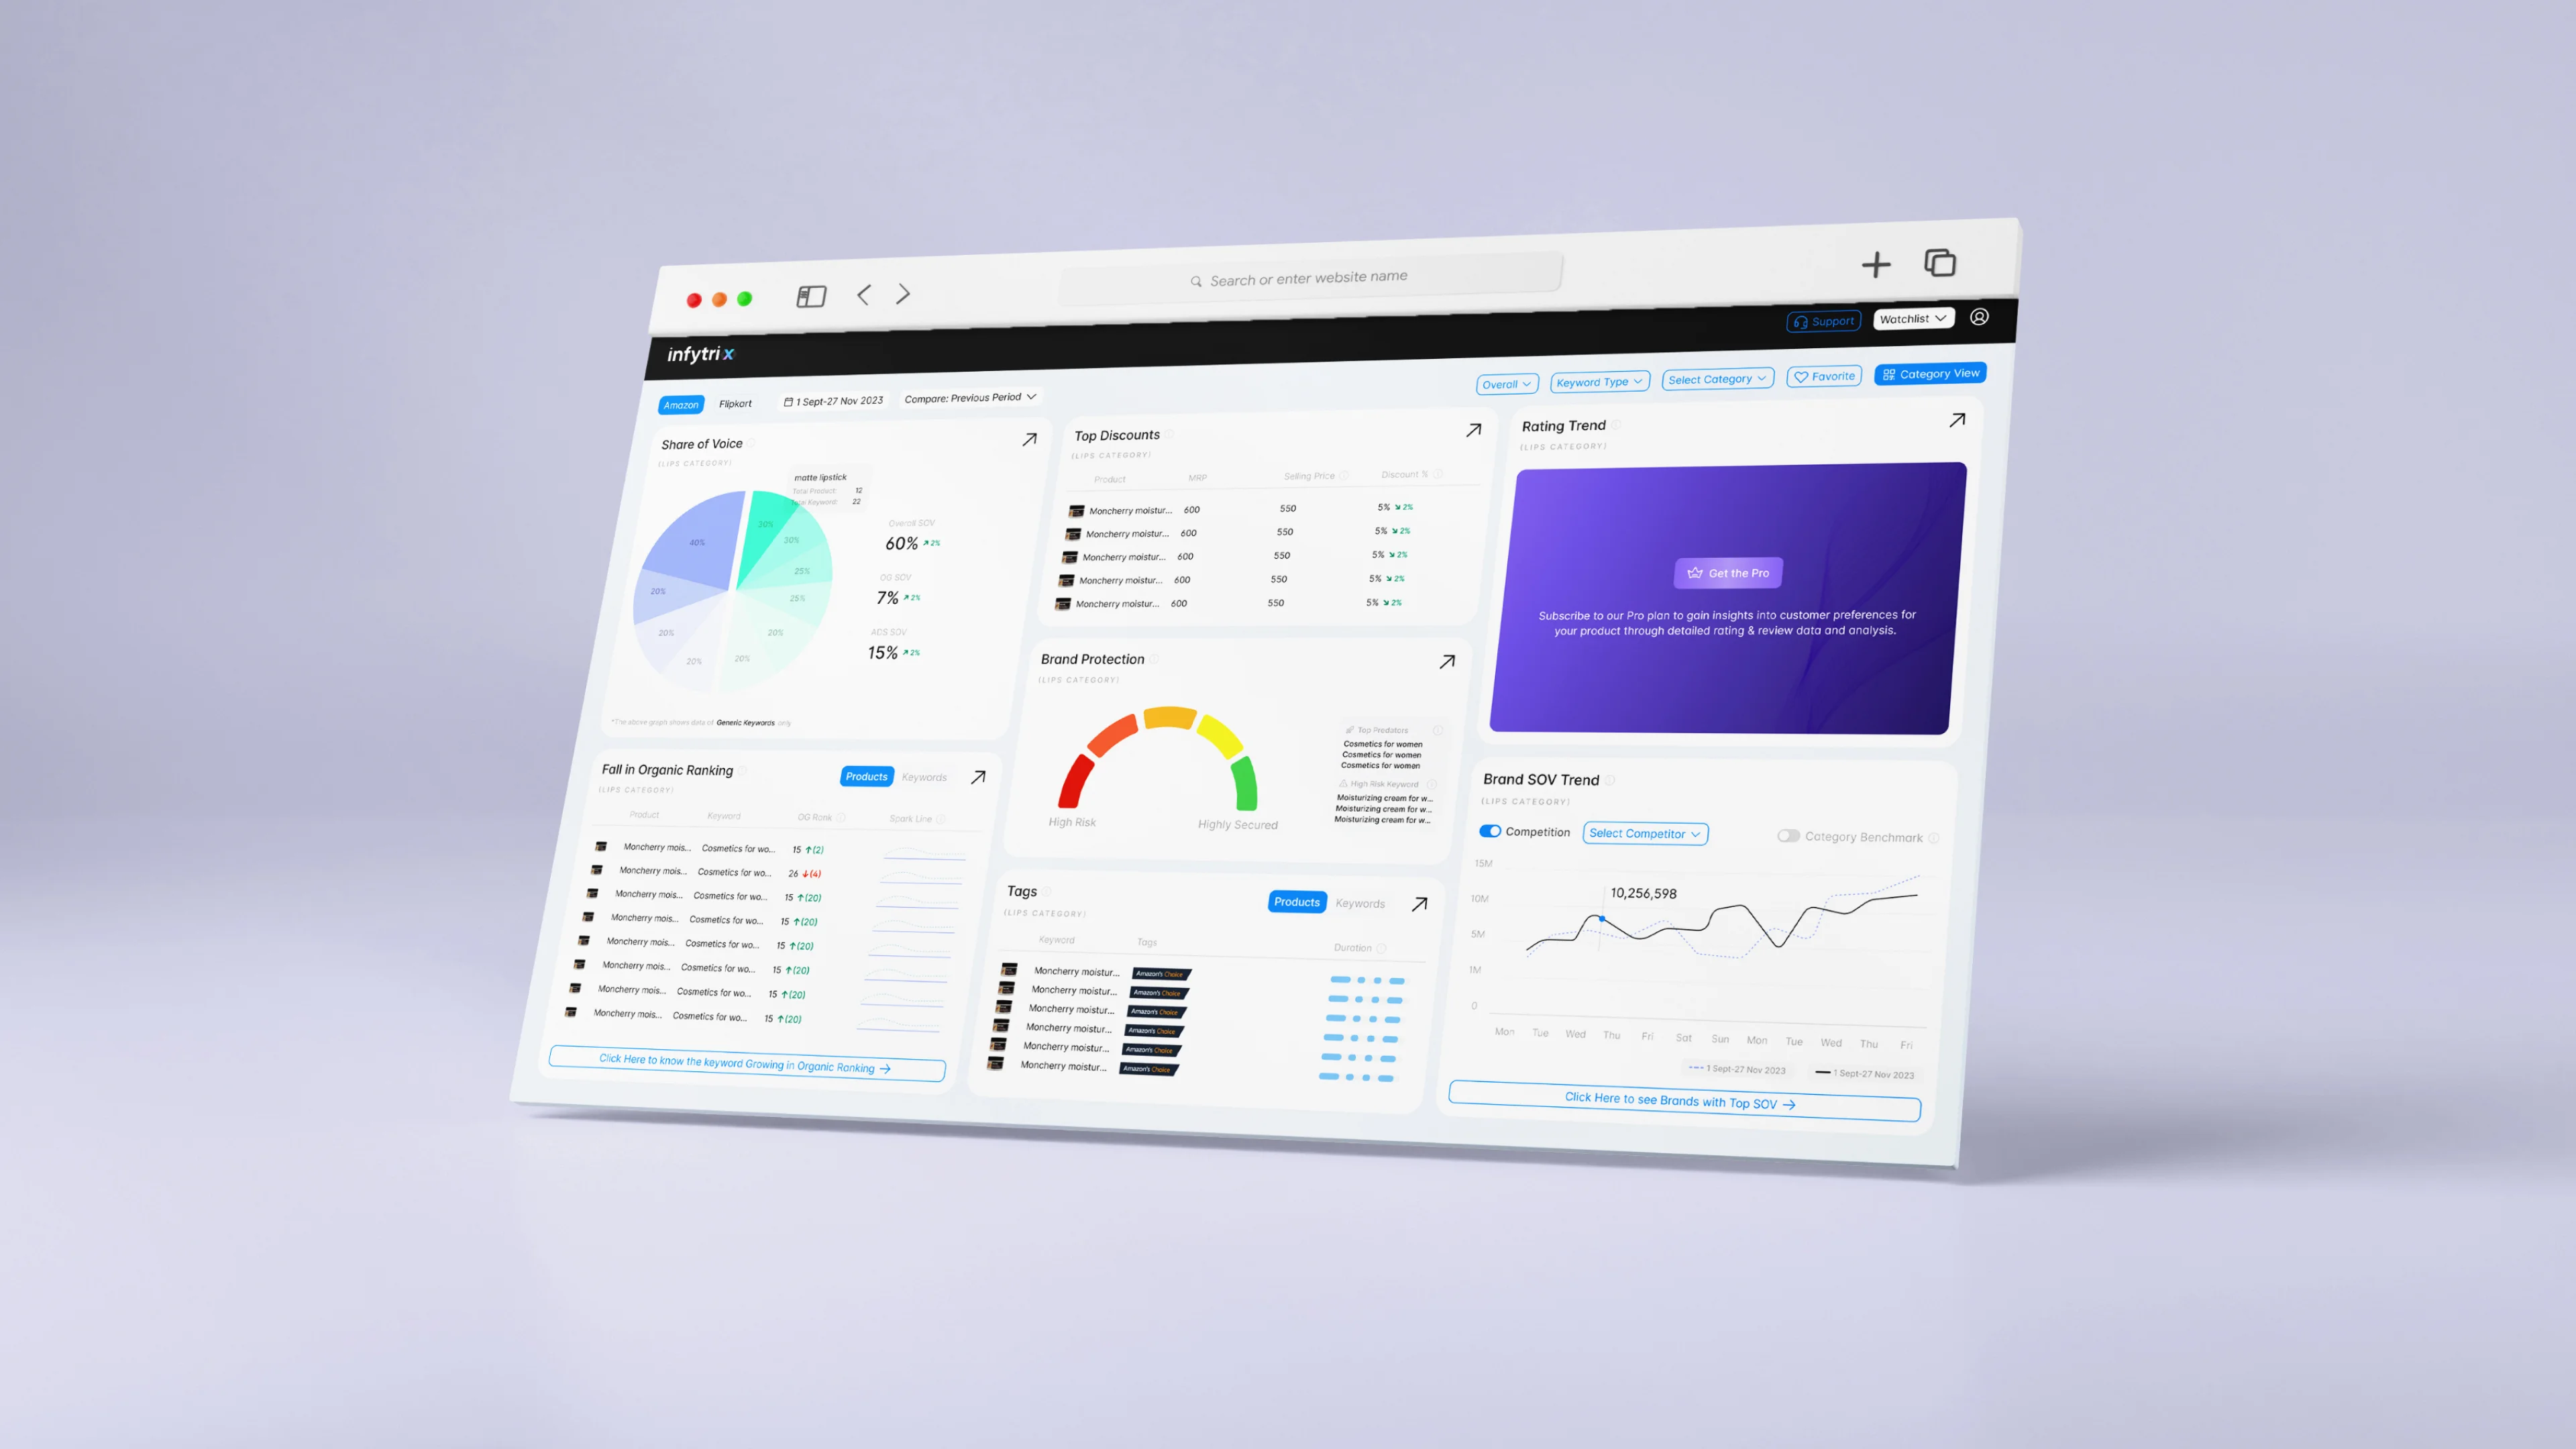
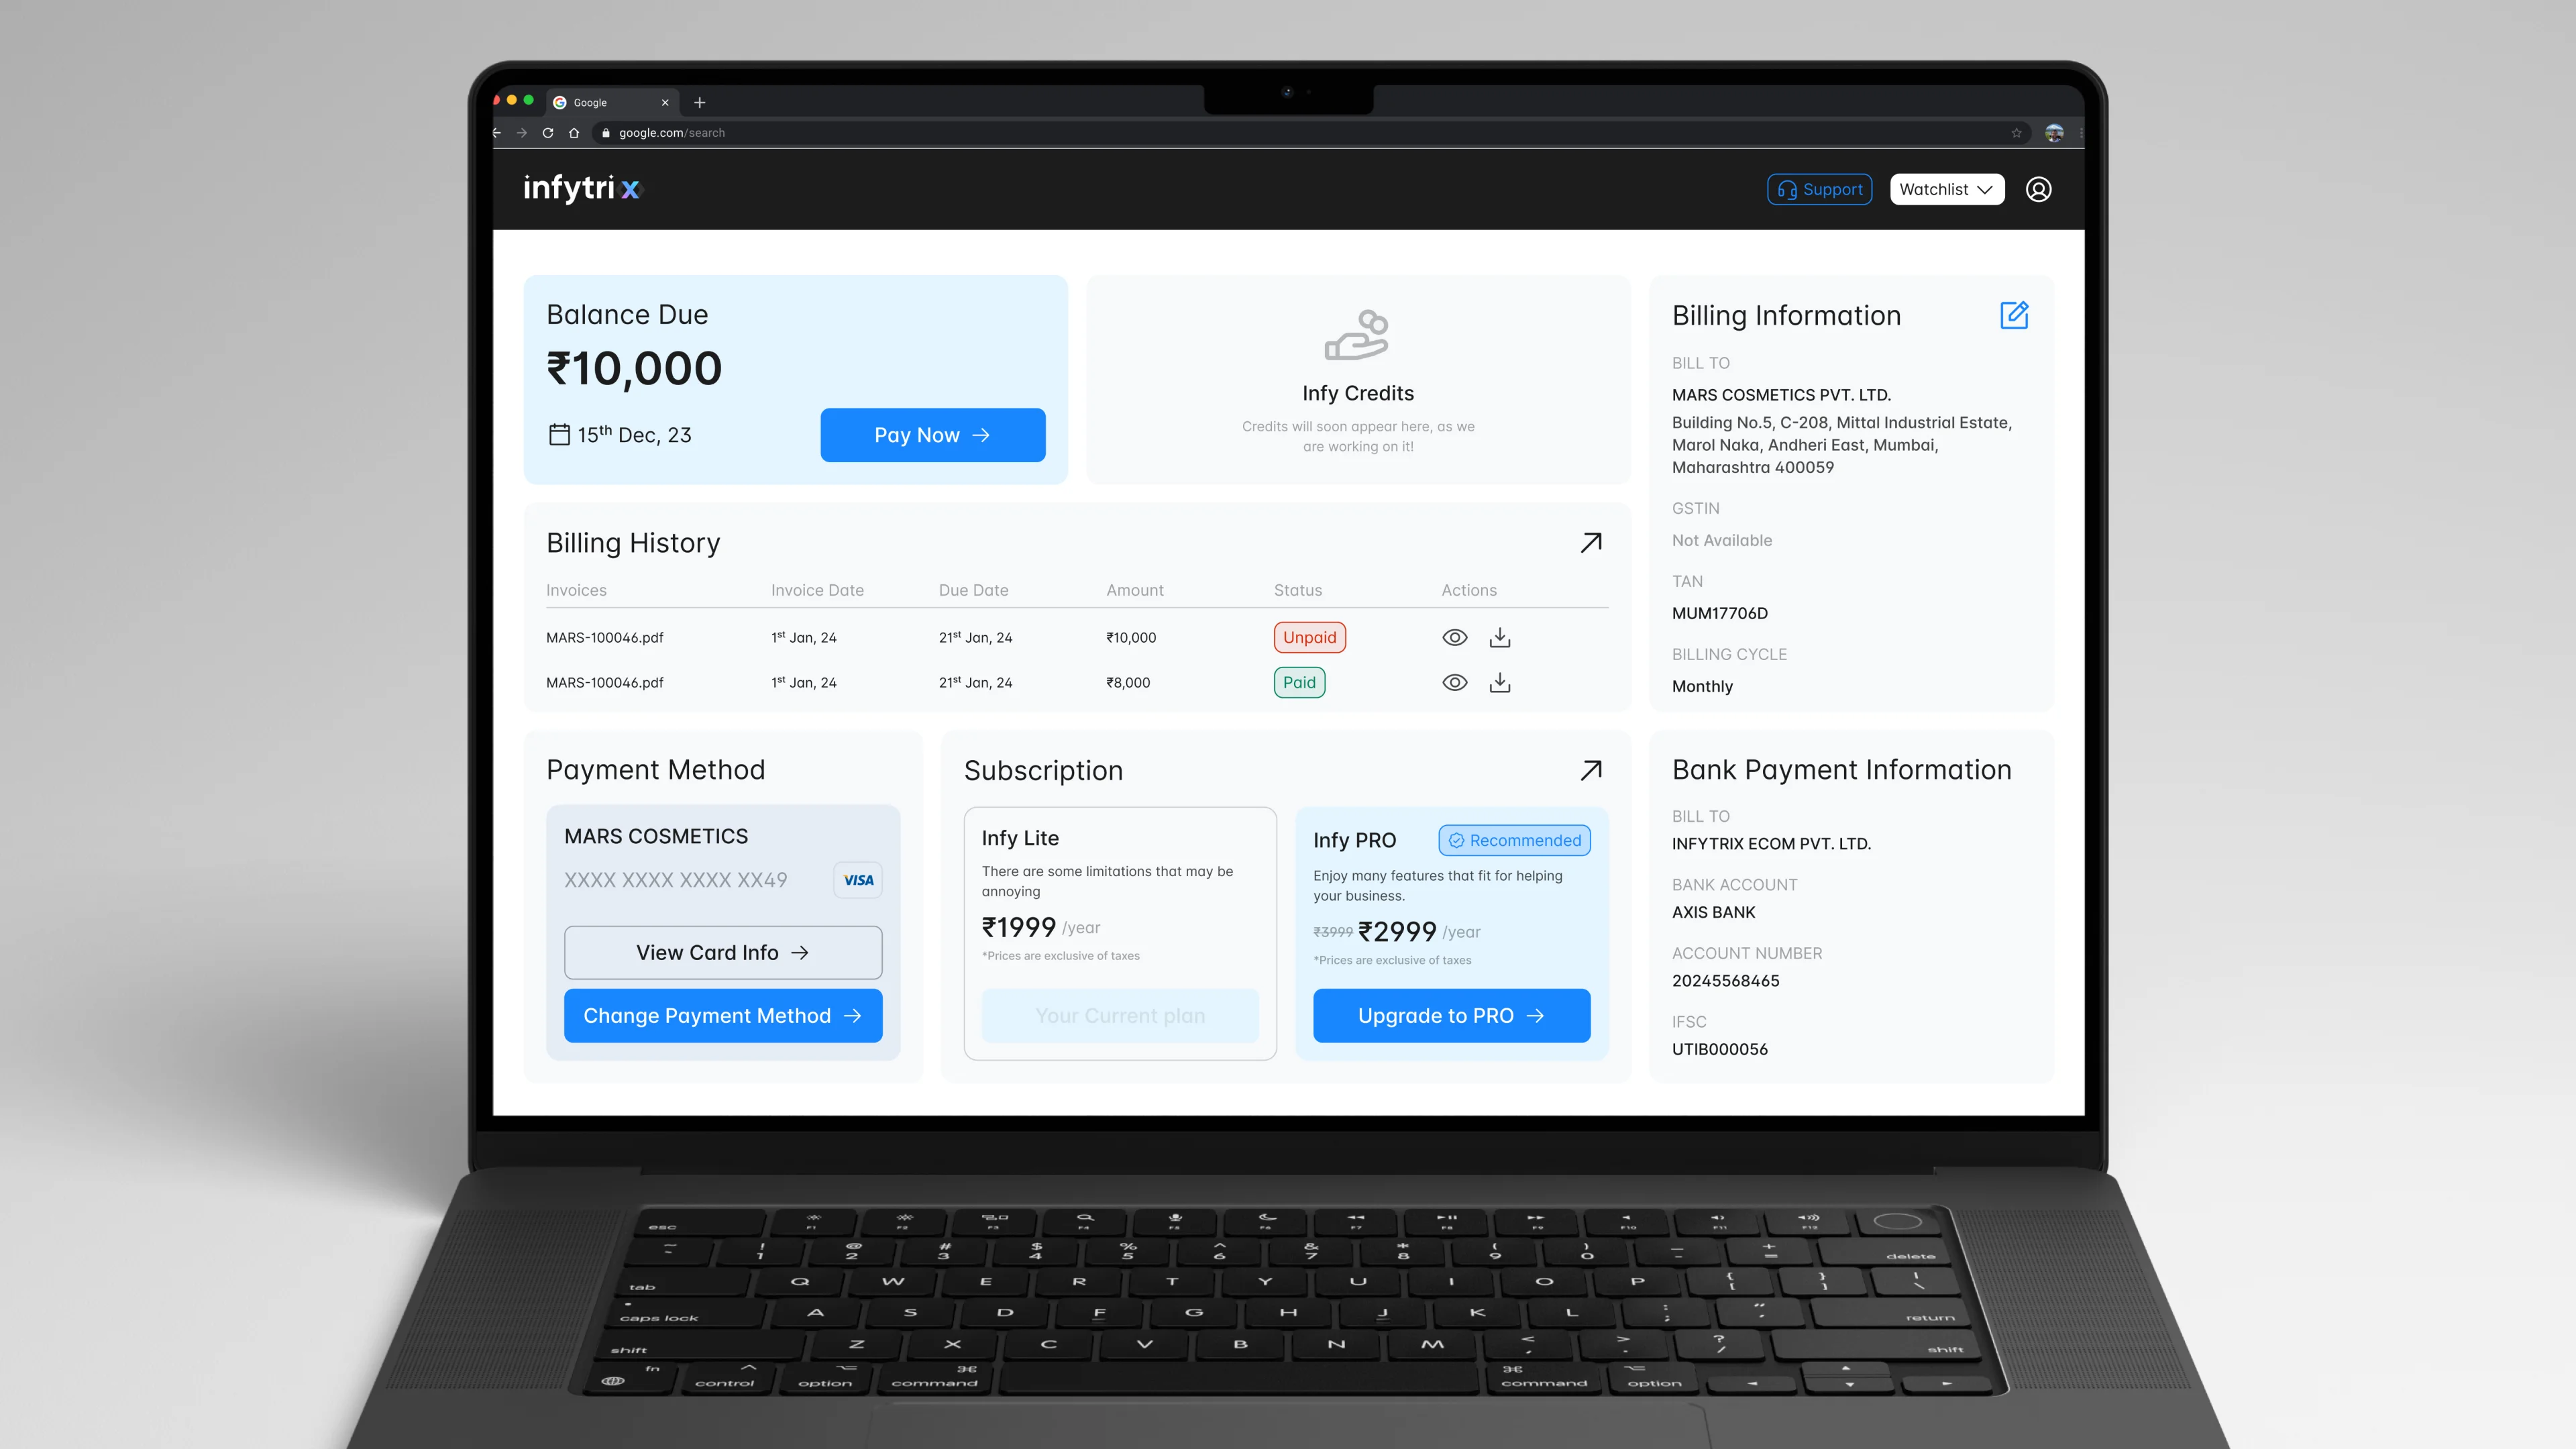
UI Design: Dashboard
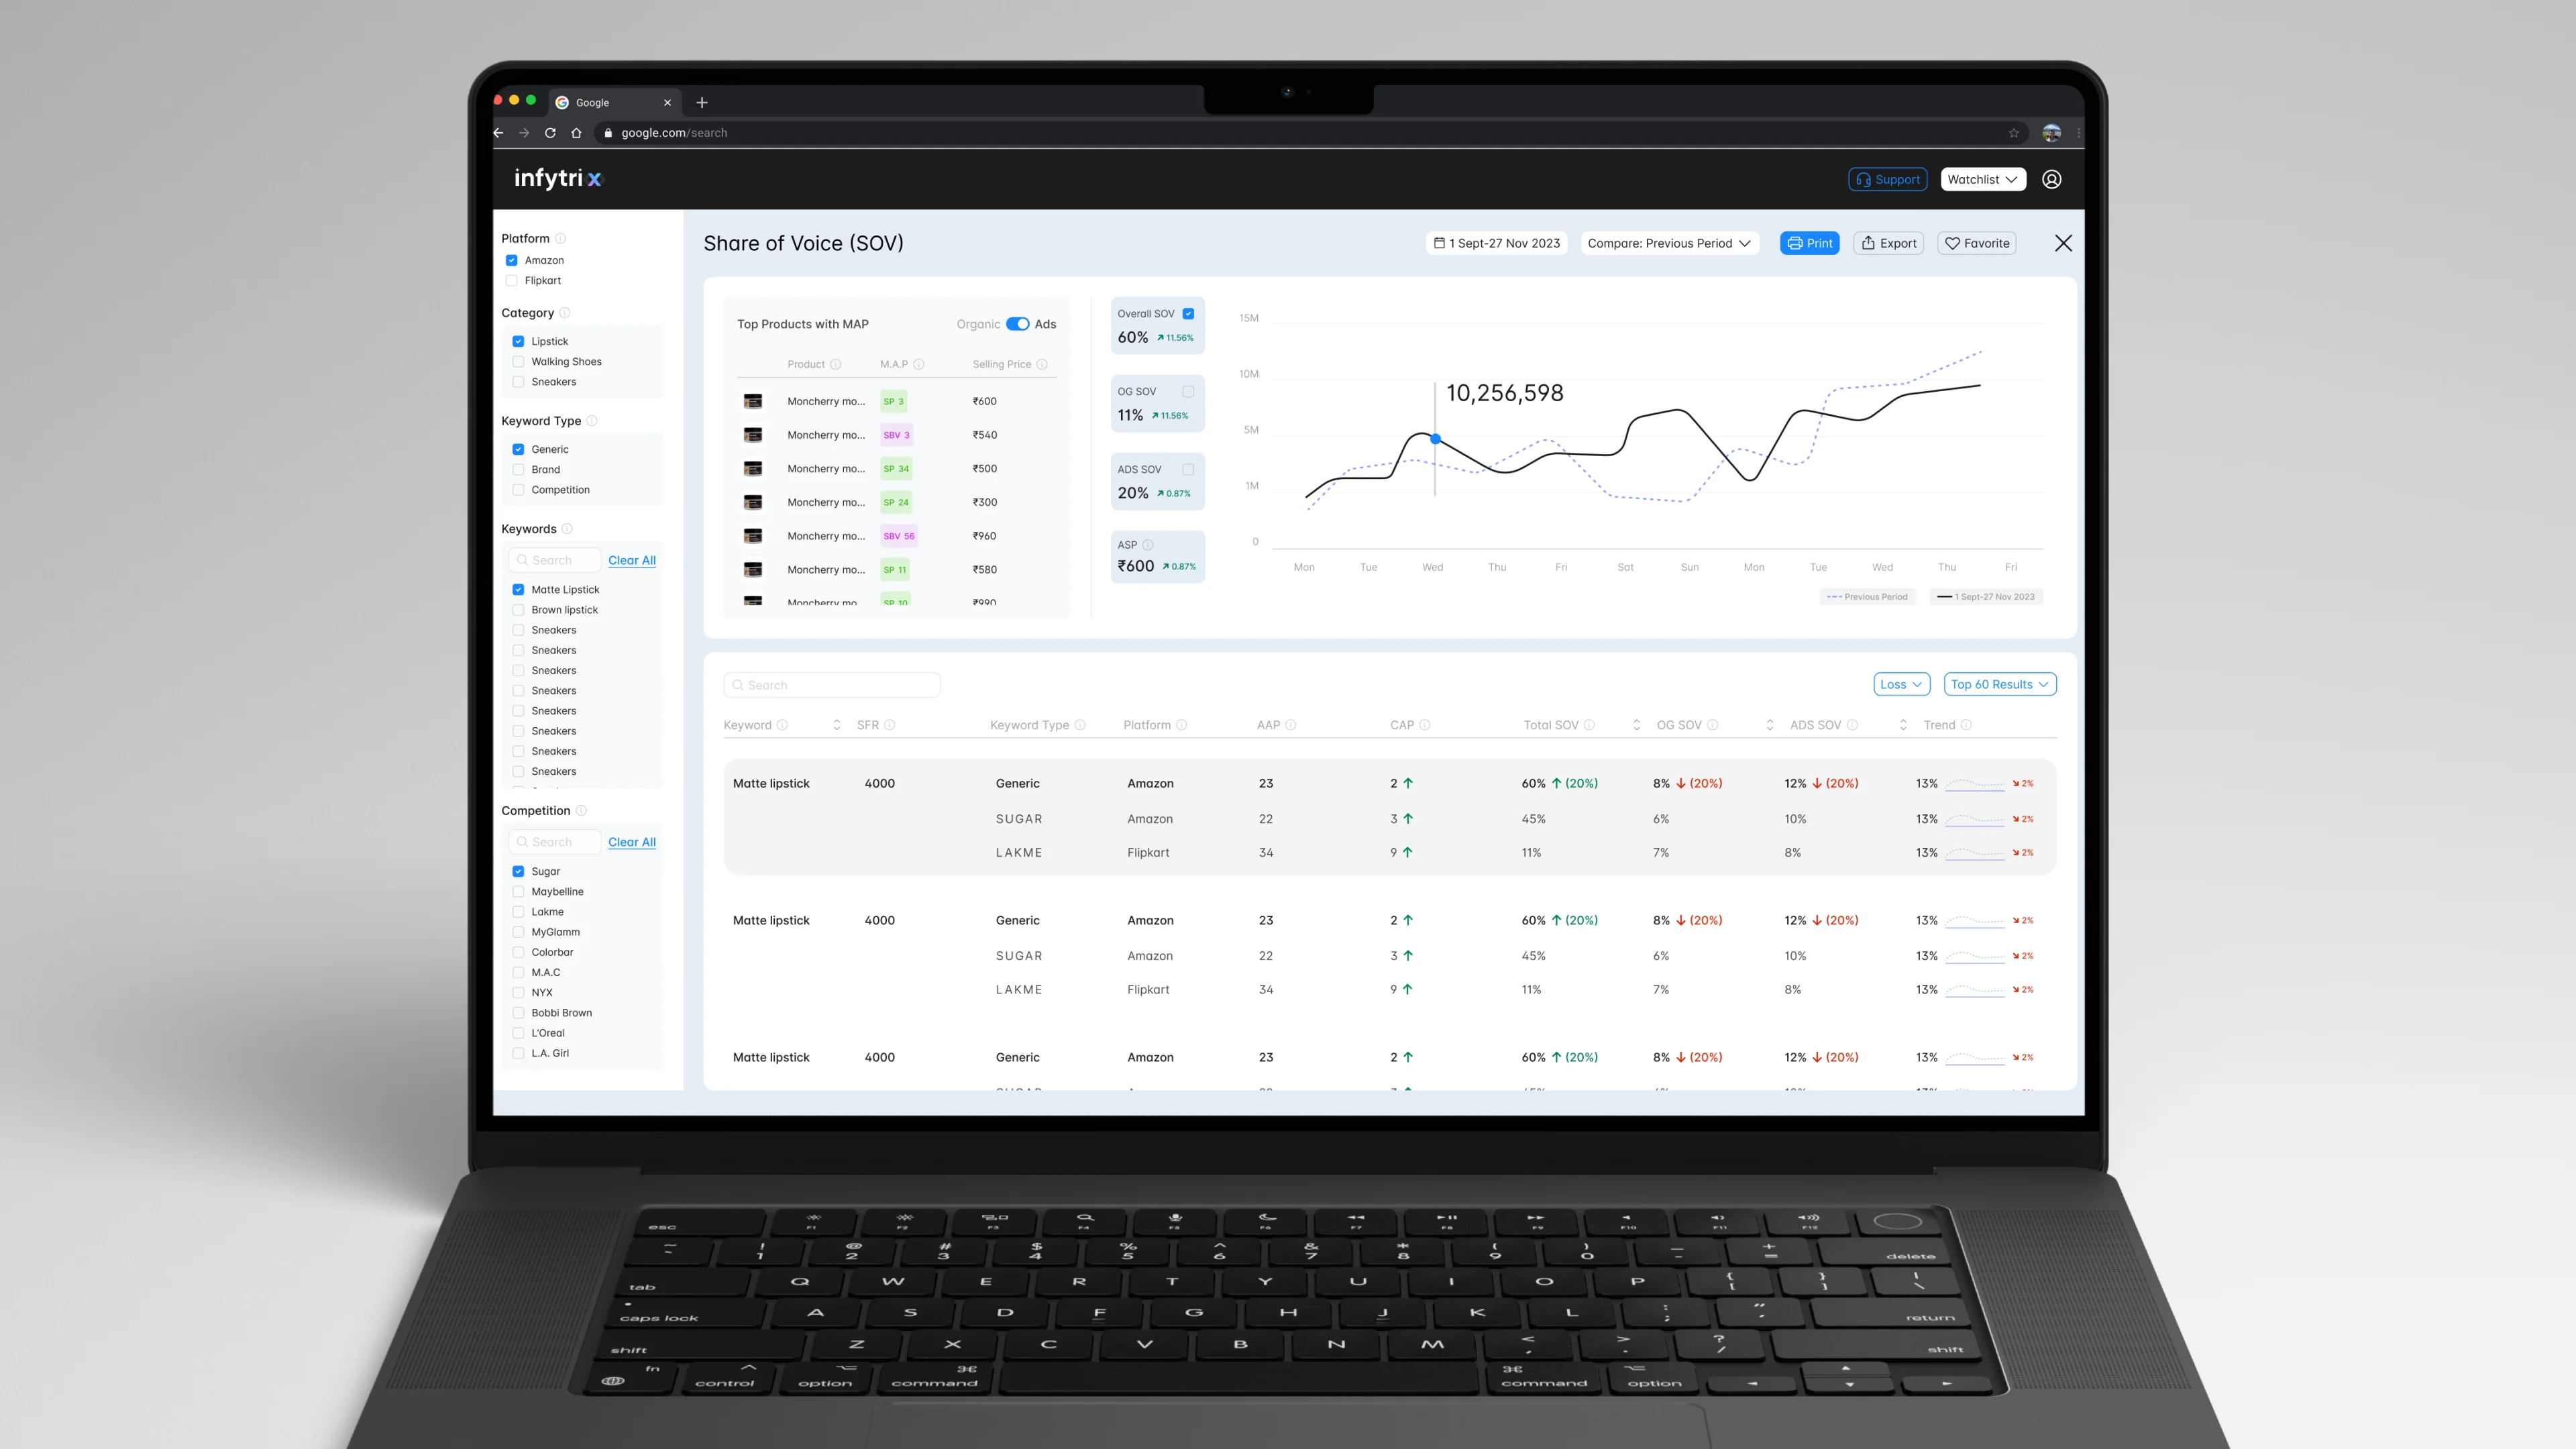
UI Design: Dashboard Internal Page
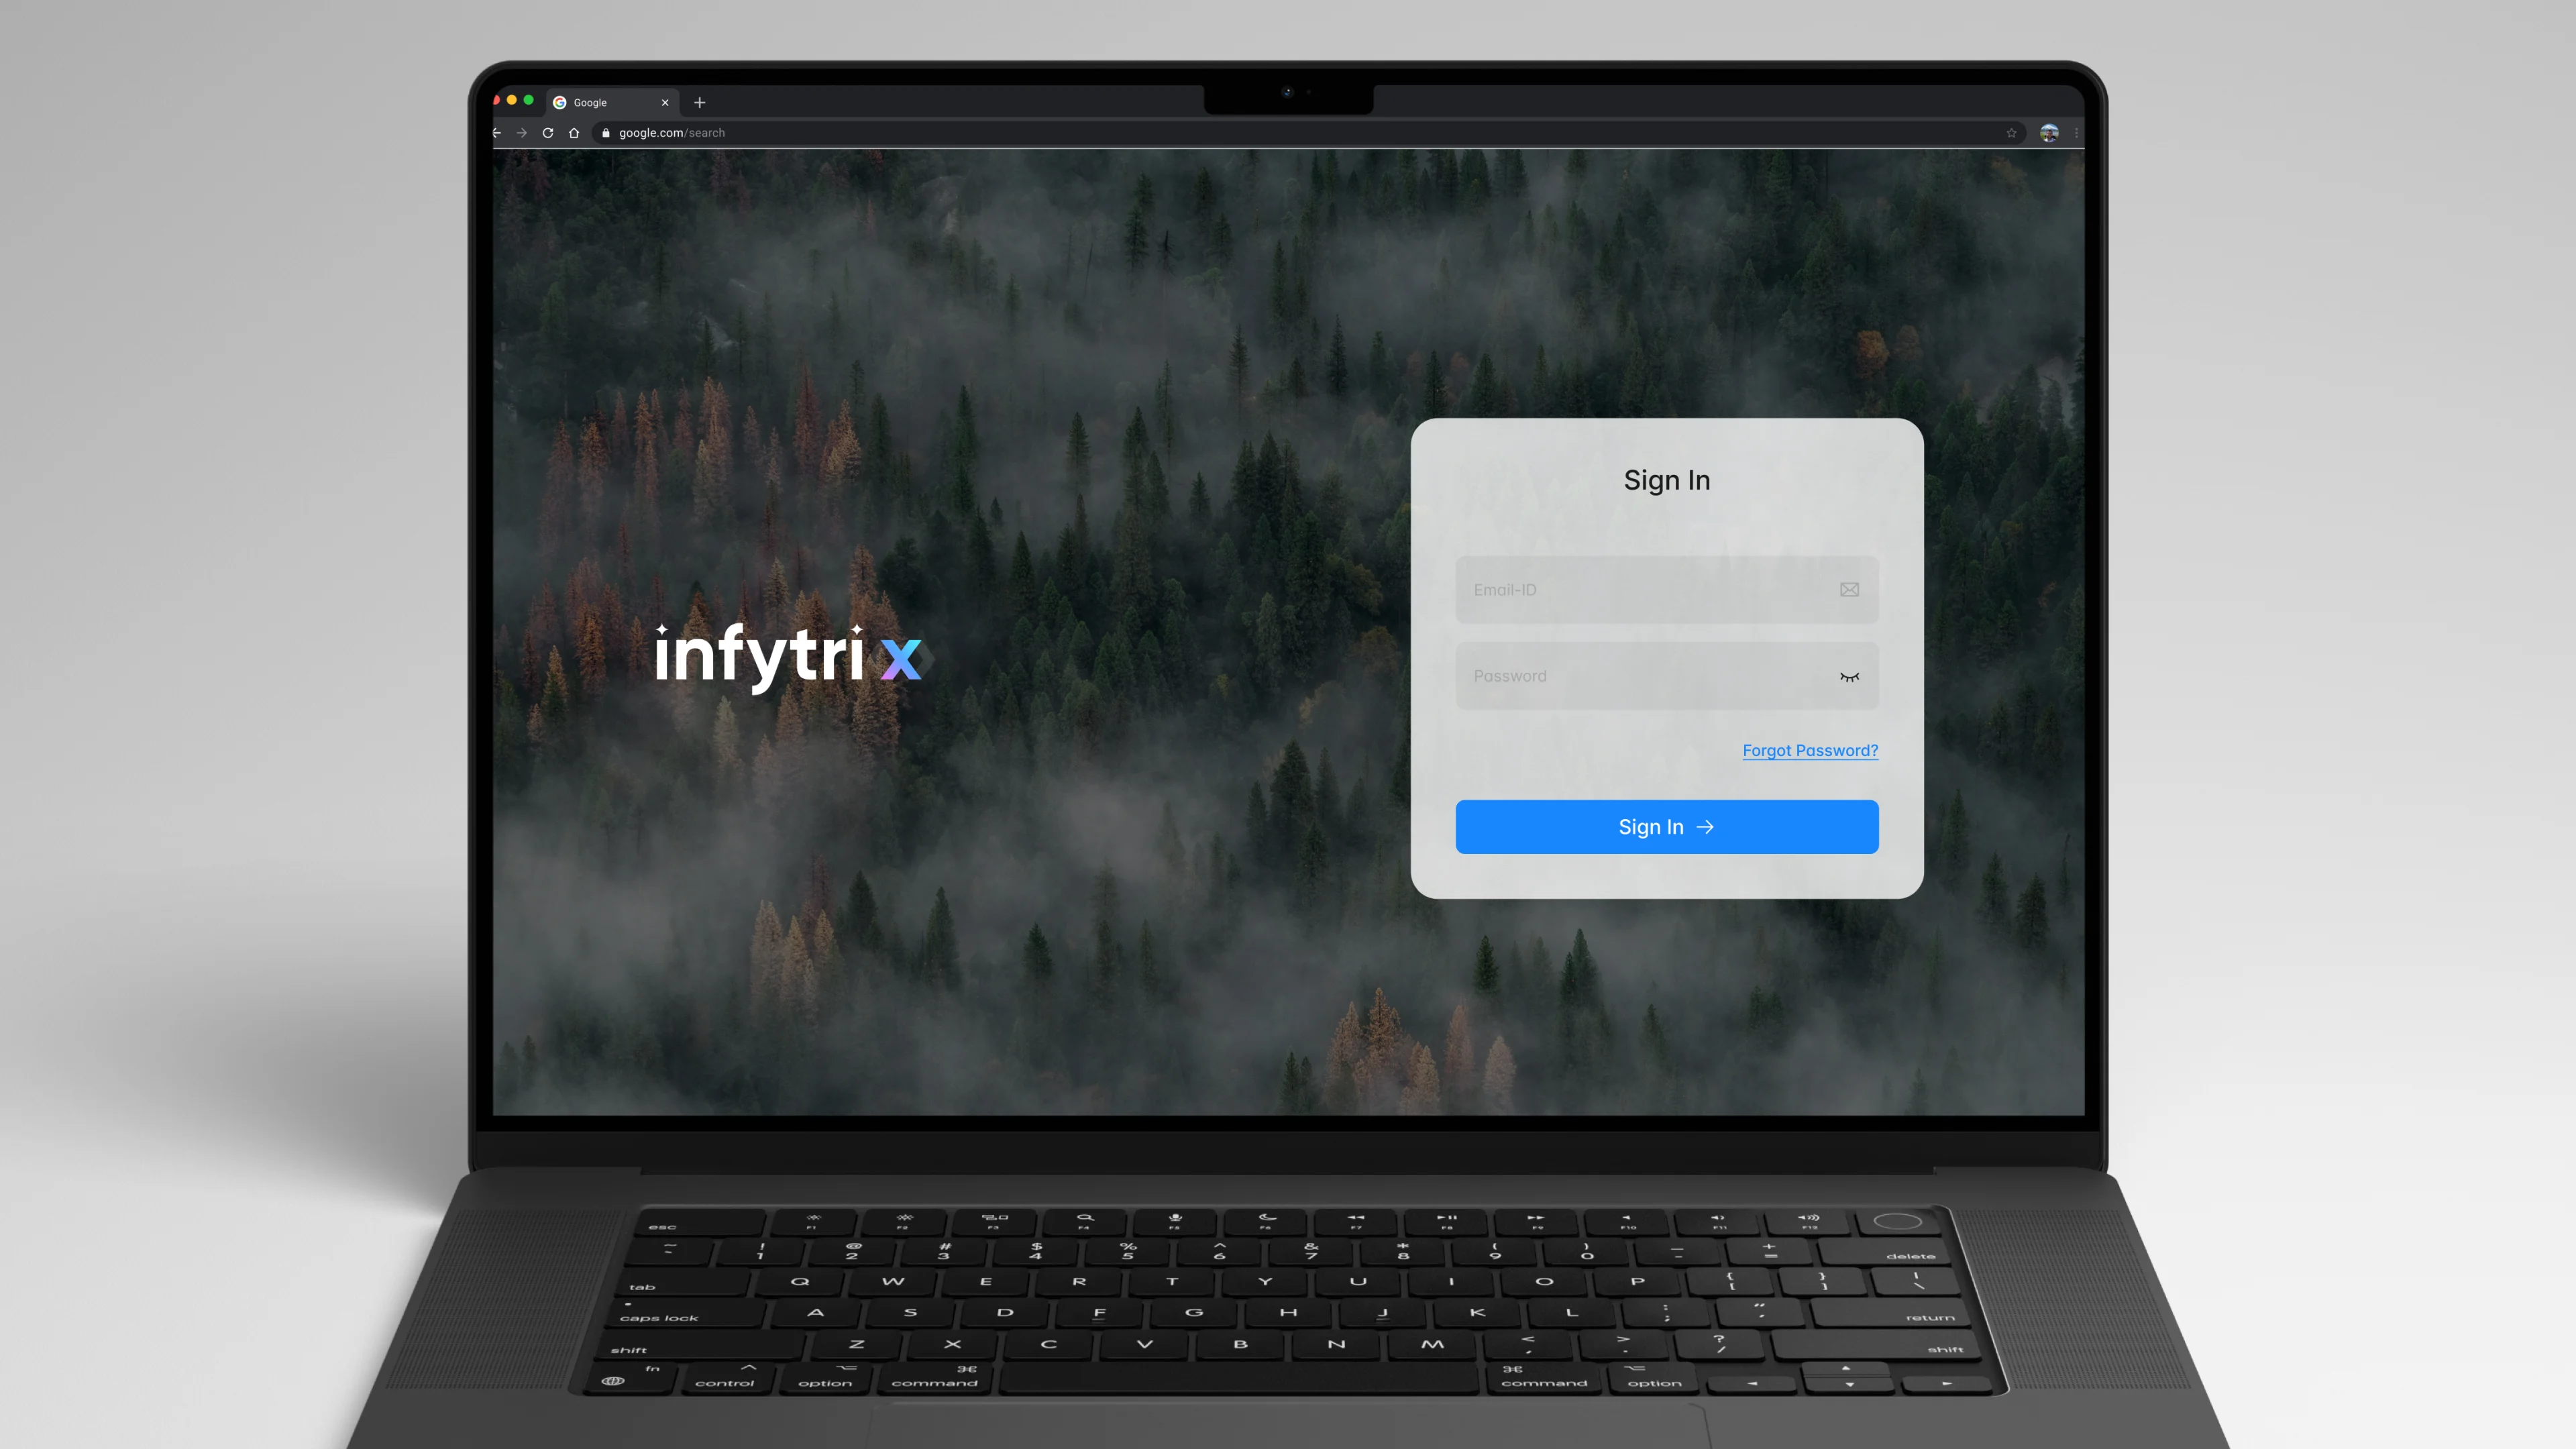
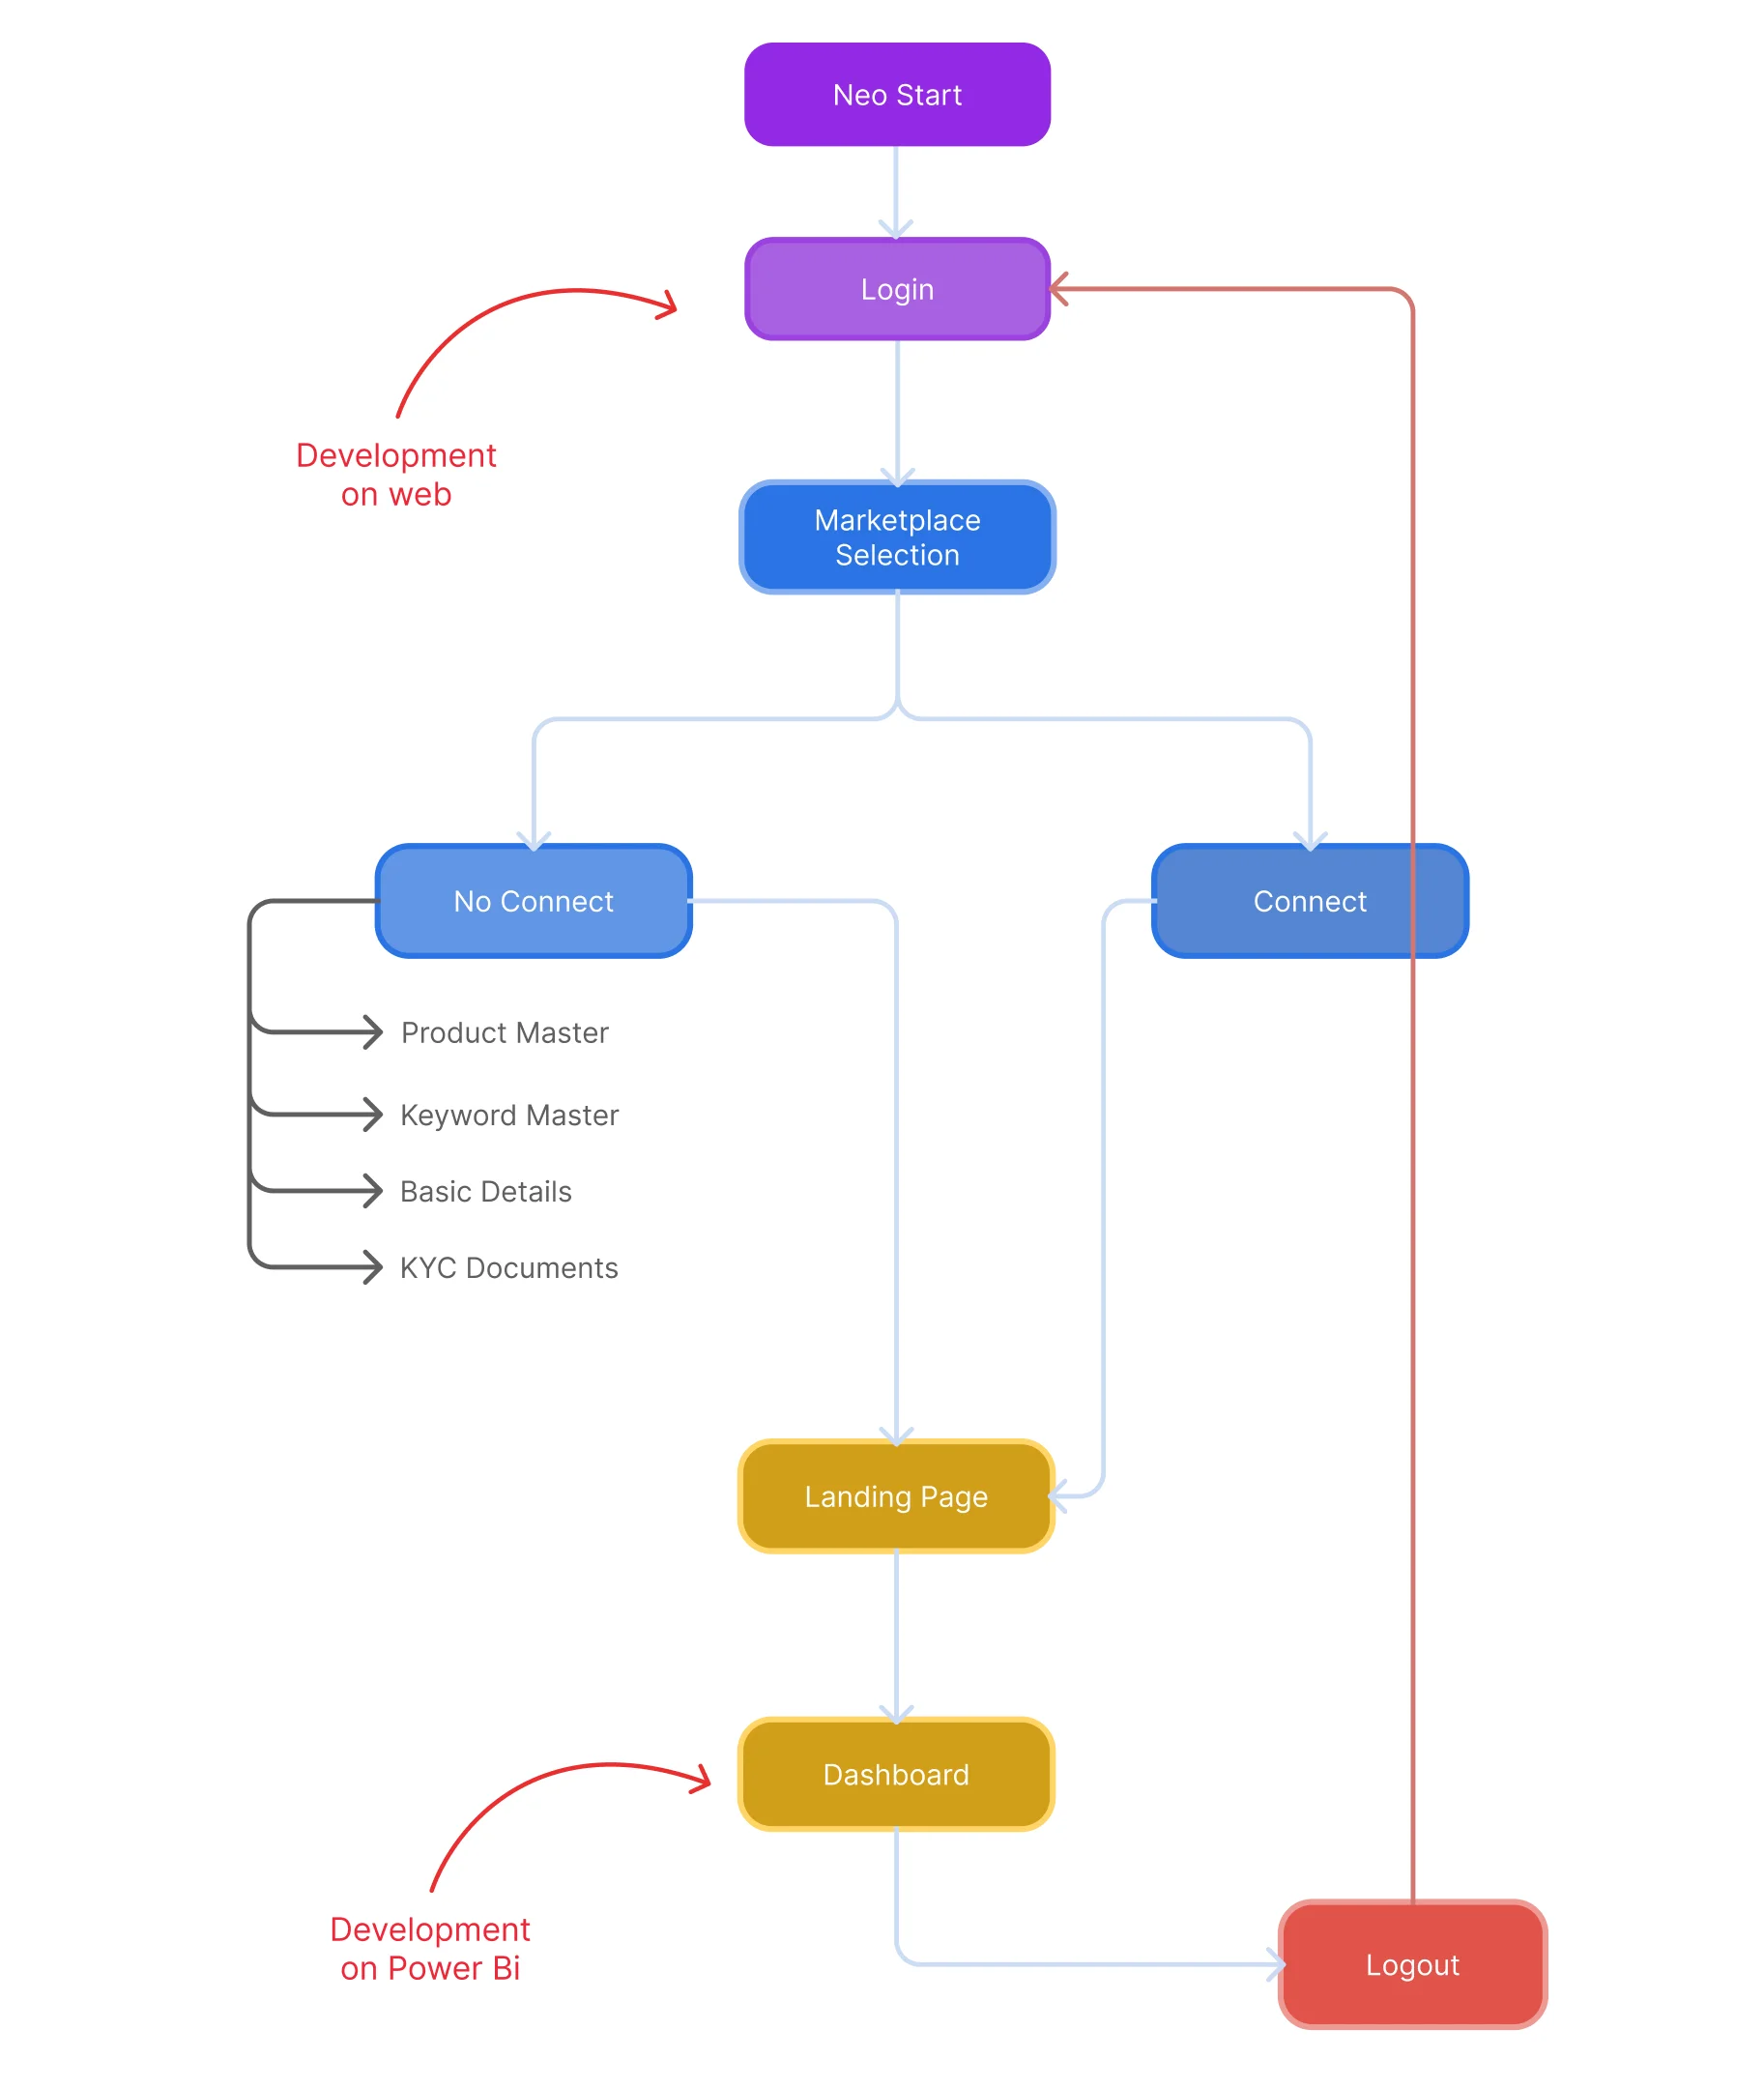
UI Design: Login
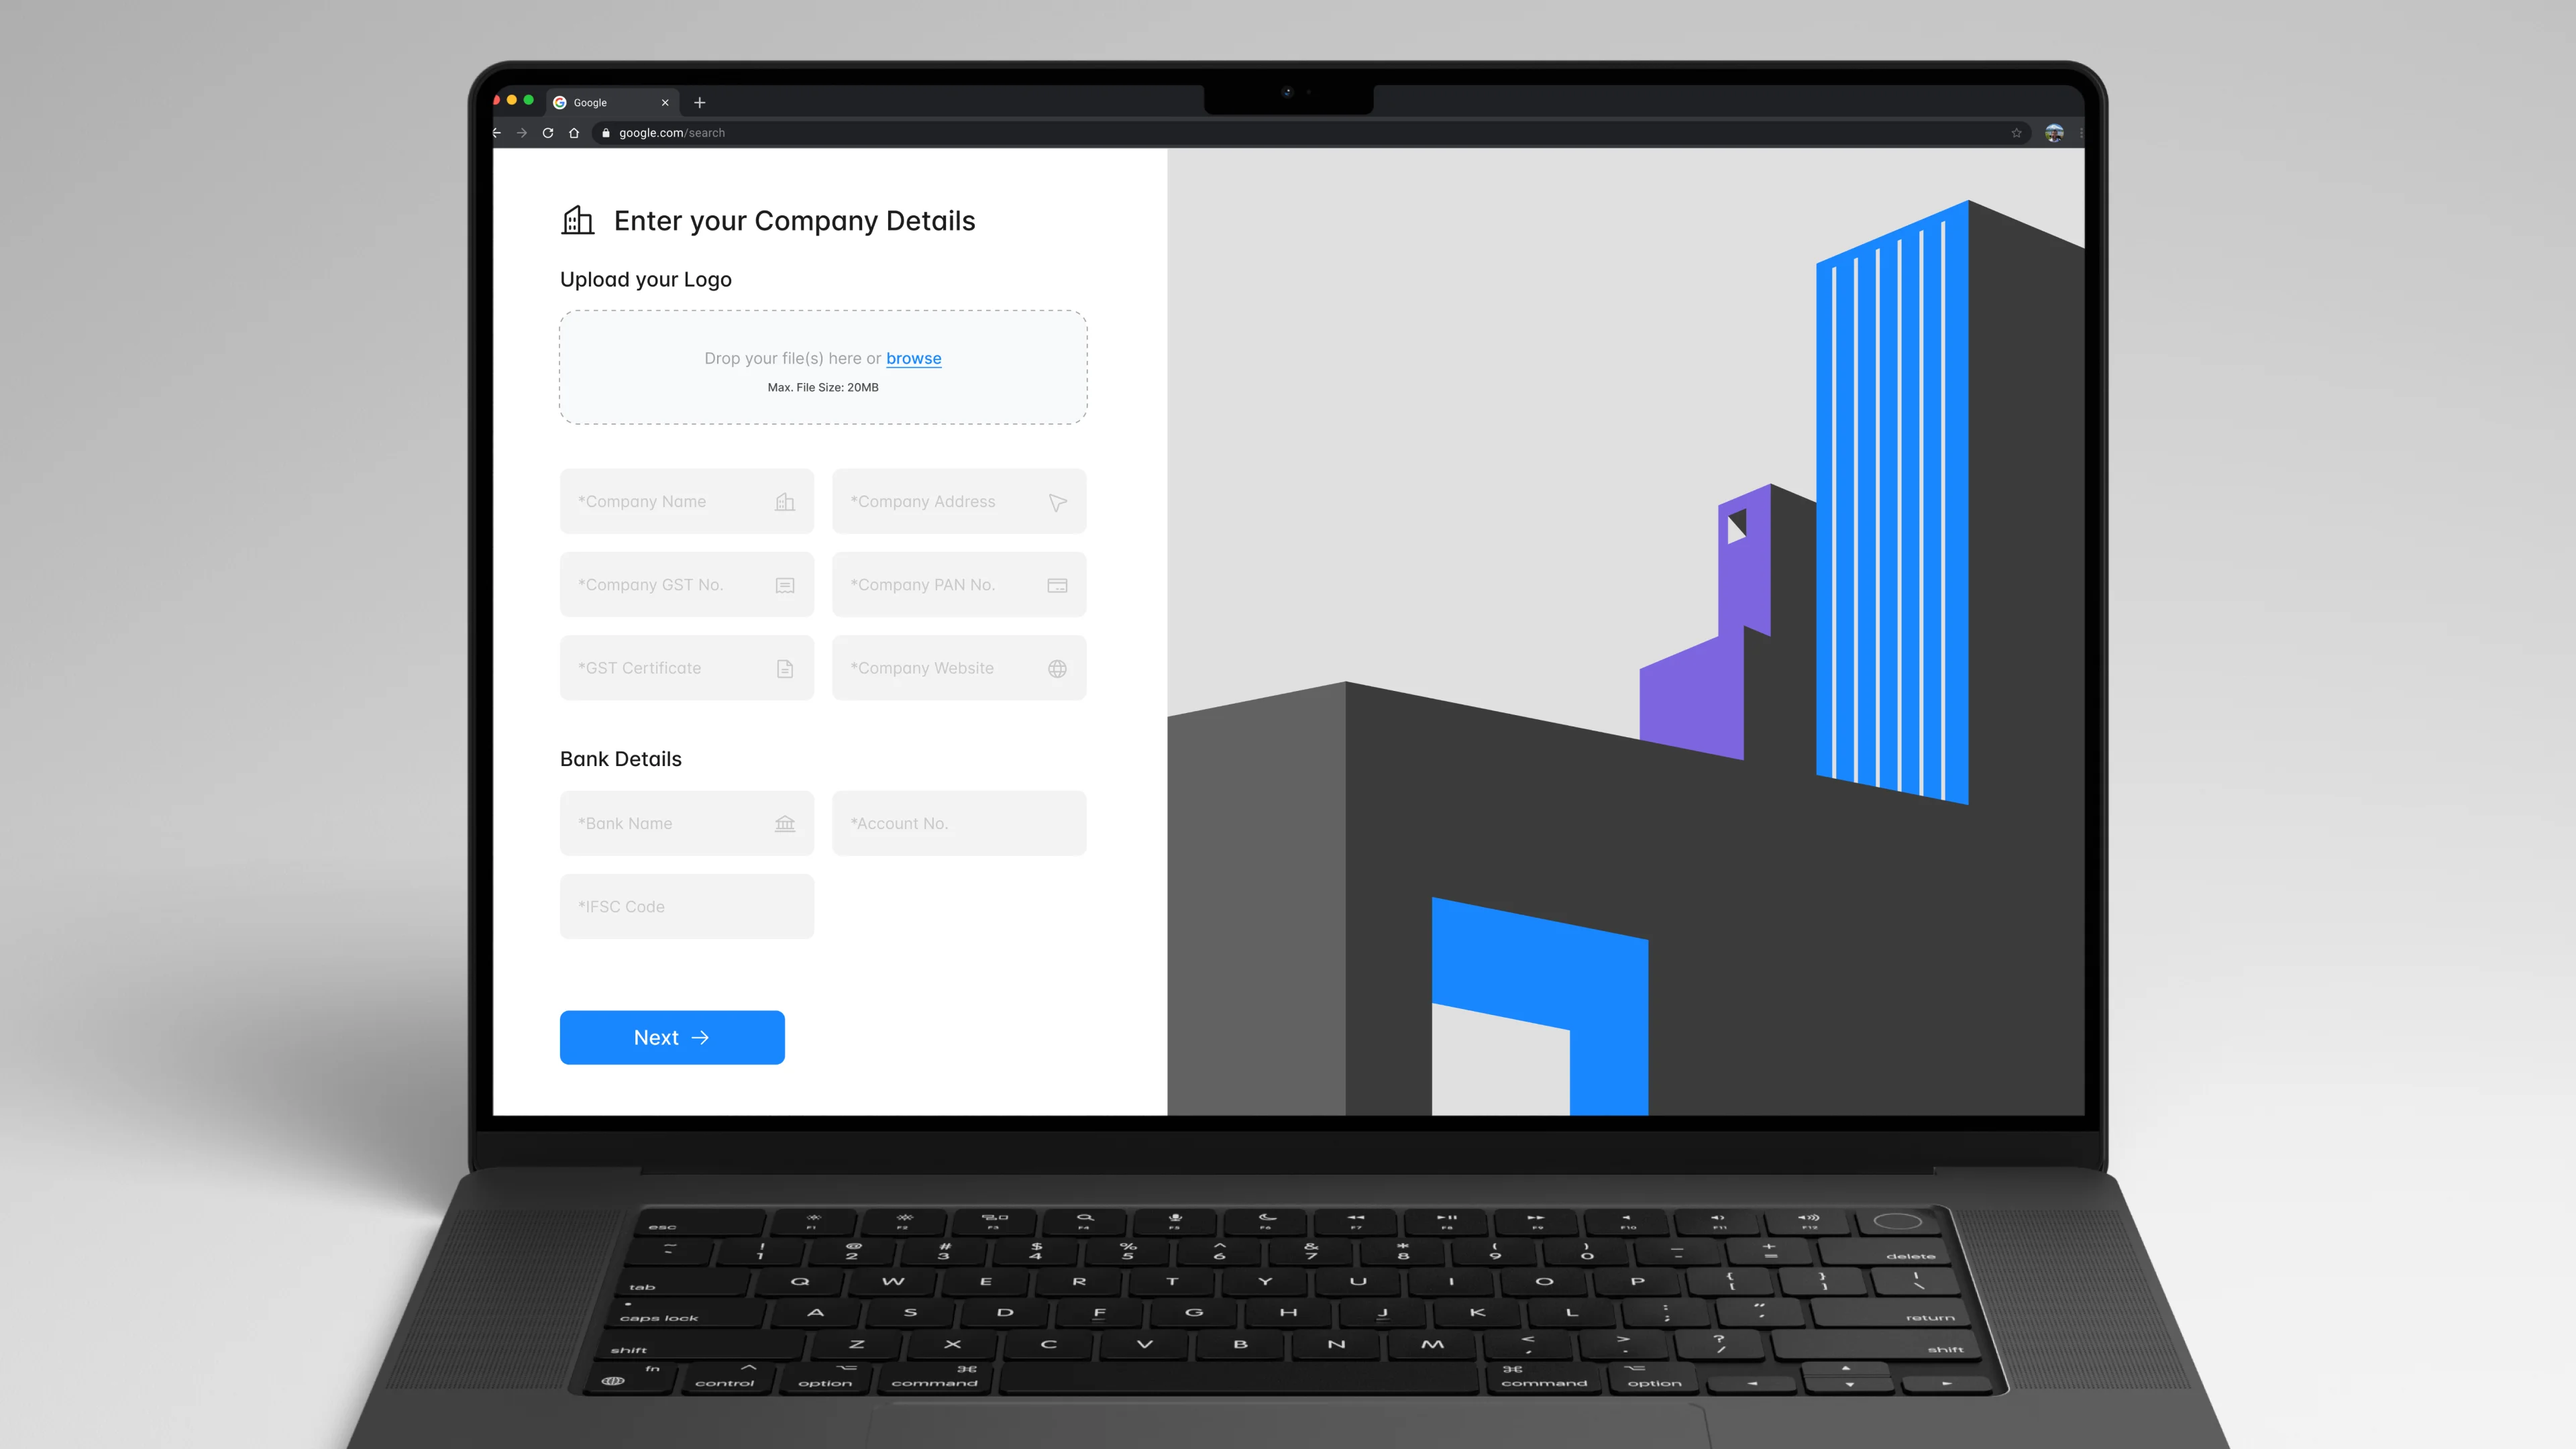
UI Design: Company Details
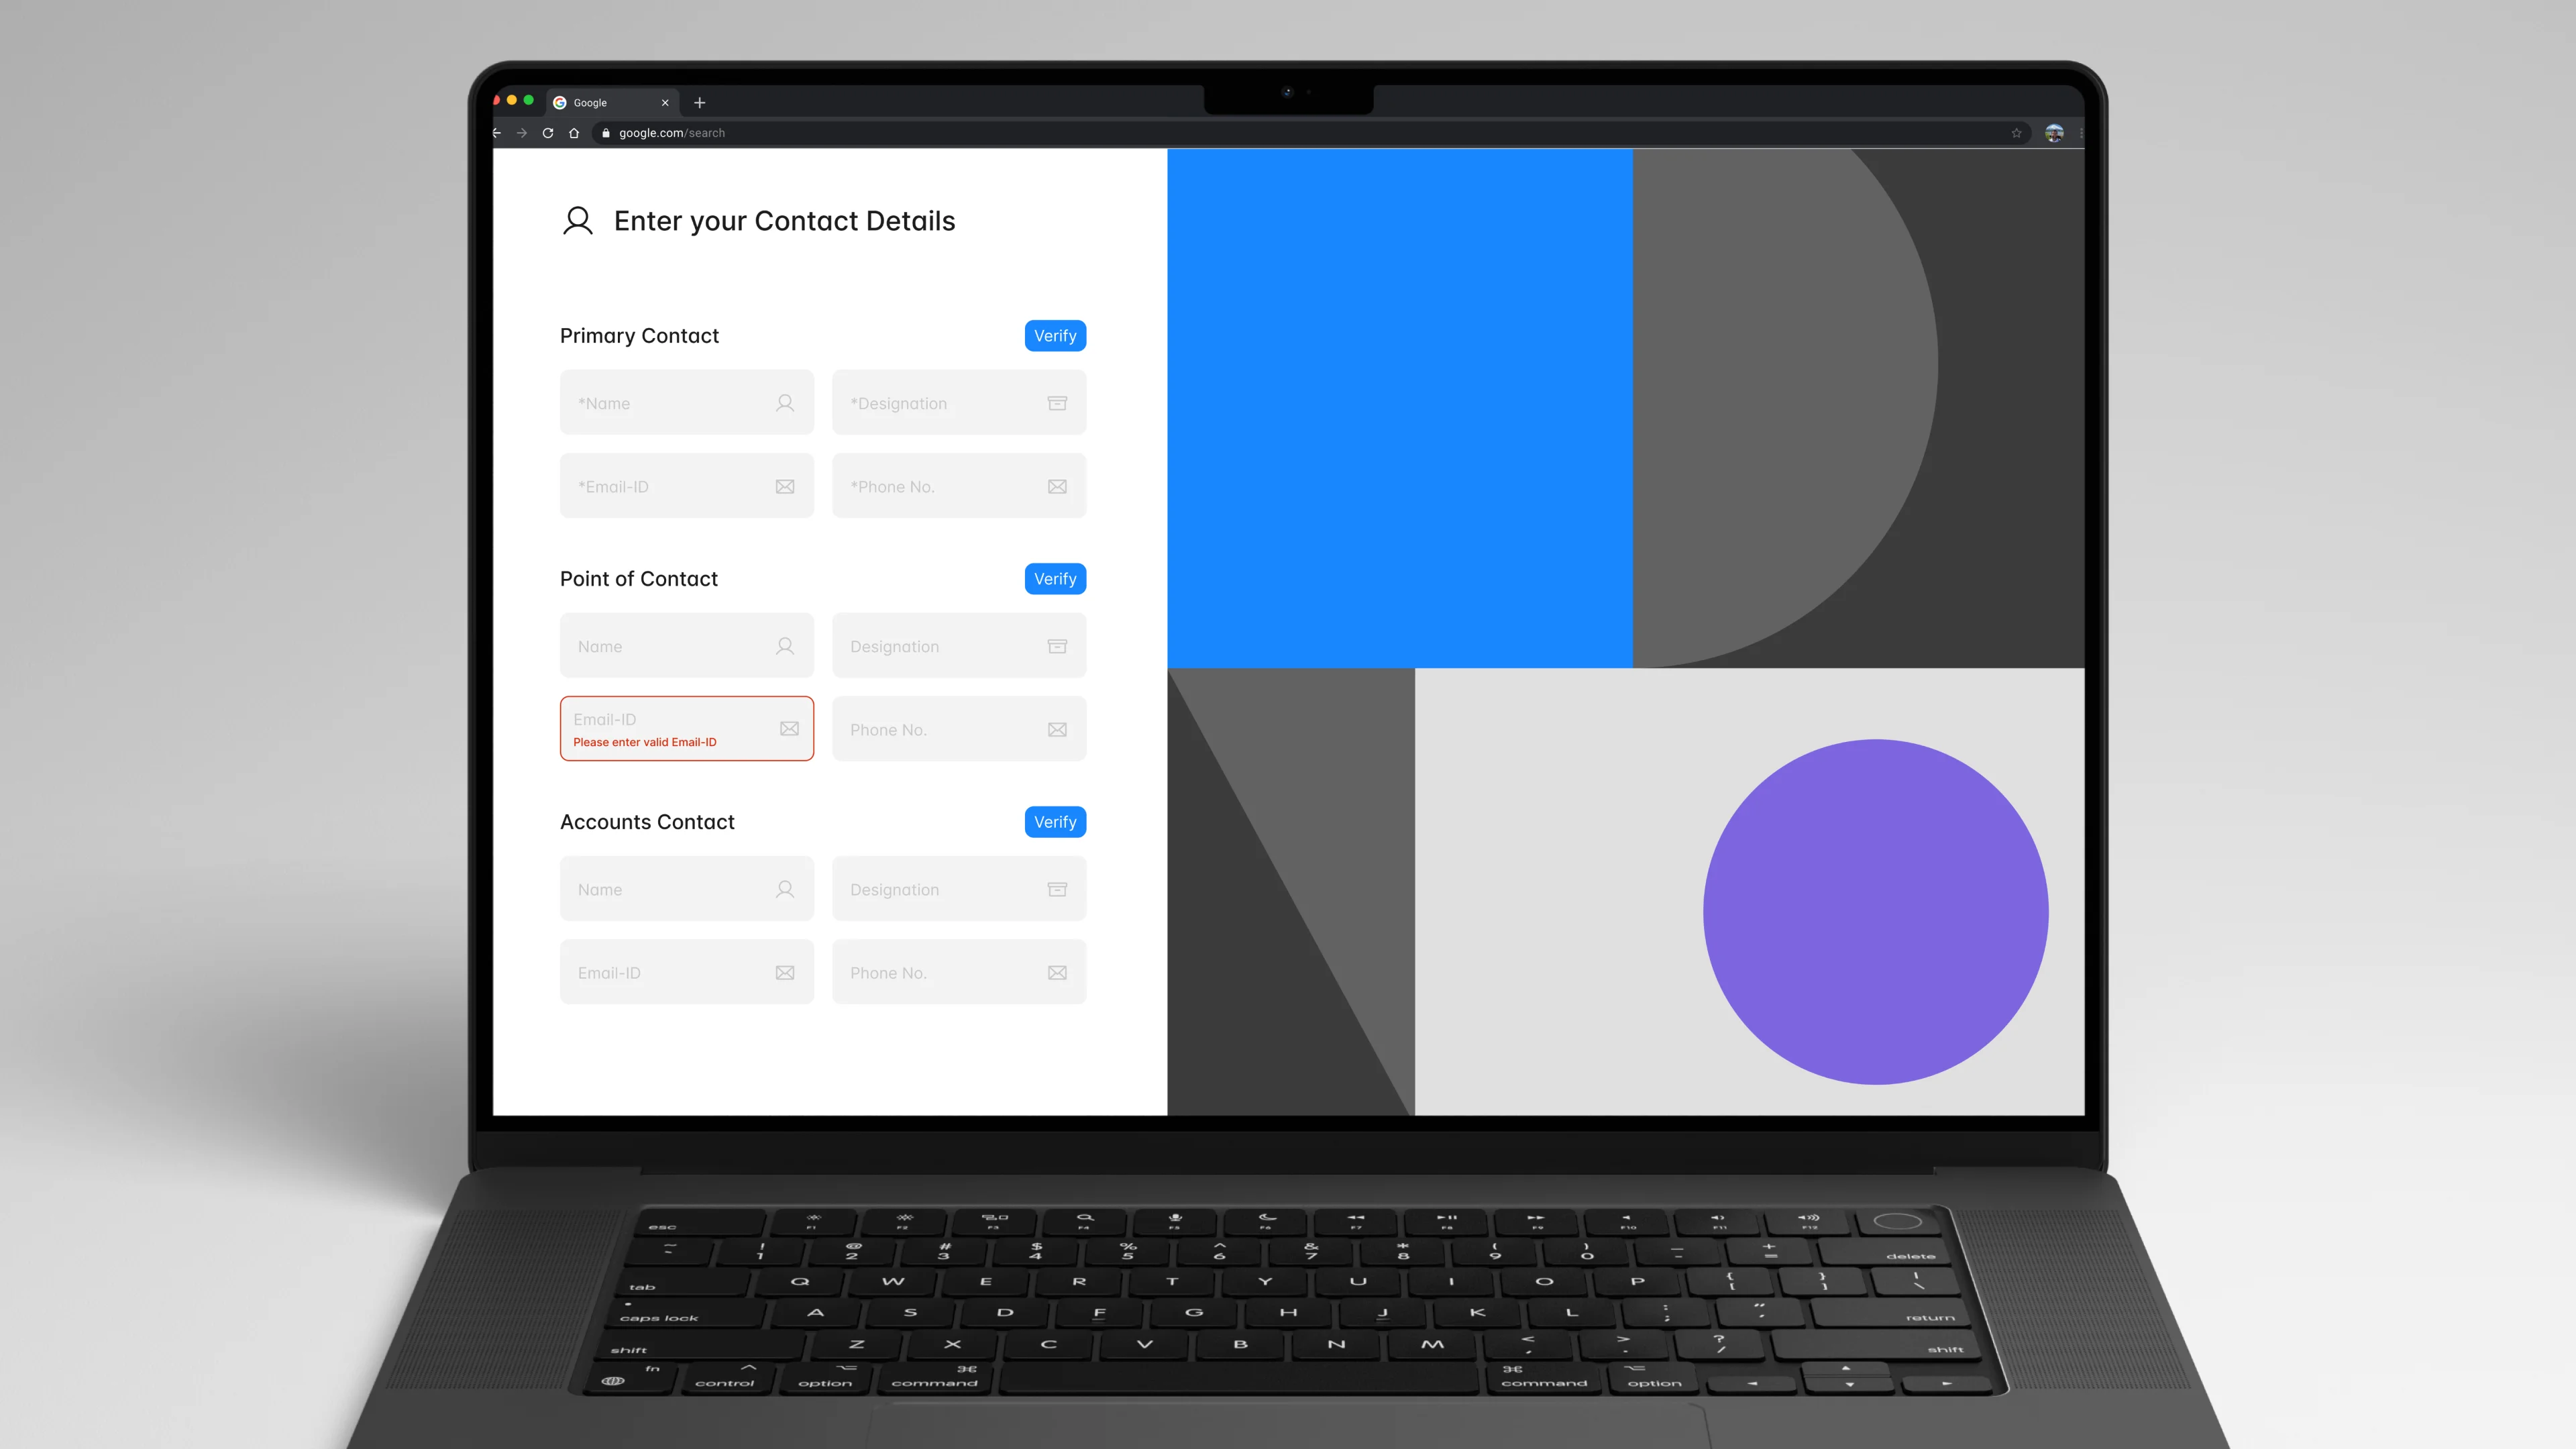
UI Design: Contact Details
UI Design: Account Details
Let's Craft Together!